Stop Loss Hunting: How Trendlines and Double Tops Feed Liquidity
JustWolves is an educational platform and is not a SEBI-registered investment advisor. Trading financial instruments involves significant risk of loss and may not be suitable for all investors. Past performance is not indicative of future results. Read our full disclaimer →
What you'll learn
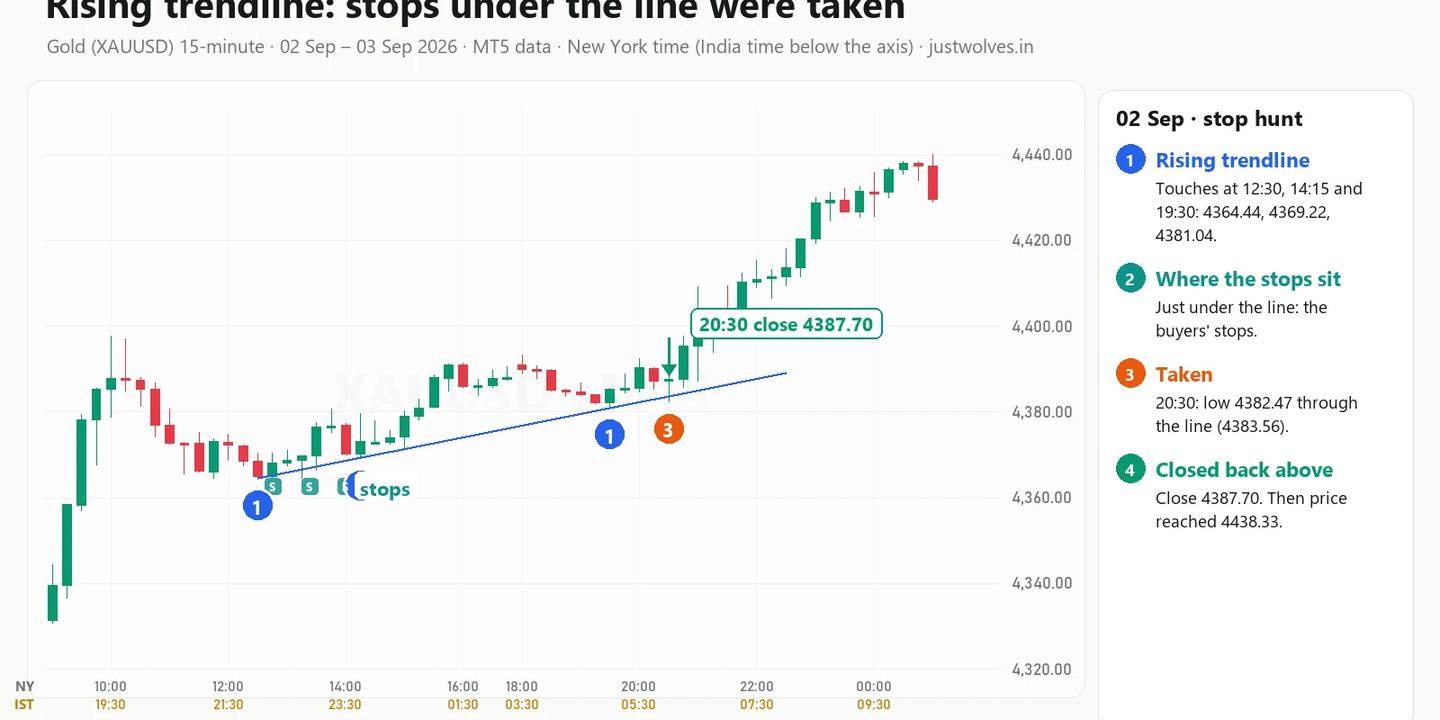
- Retail liquidity is the stop losses and breakout orders created by textbook patterns.
- Trendlines, double tops and bottoms, support and resistance and ranges all put the crowd's stops in predictable places.
- The stronger a level looks, the more stops are likely to sit behind it.
- A grab looks like a quick run beyond the level and a close back inside; a real breakout closes beyond and keeps closing beyond.
- Always confirm with the next candles, size the position for being wrong, and check the economic calendar.
In this article · 12 sections
Stop loss hunting is what traders call it when price runs to the obvious stops and turns. Those stops are retail liquidity: the pool of stop losses and breakout orders that builds up around the patterns most trading books teach: trendlines, double tops and bottoms, support and resistance, and range breakouts. Because so many traders use the same patterns in the same way, their orders sit in the same places. This lesson shows where those orders sit for each pattern, walks through six real gold charts from MetaTrader 5 (MT5), and includes a breakout that was real, so you learn to tell the two apart.
What you will learn
- What retail liquidity is, and why textbook patterns create it
- Trendline liquidity: rising and falling lines
- Double tops and double bottoms
- Support and resistance: why "strong" levels attract price
- Range breakouts and fake breakouts
- When the breakout is real: the failed example
- A checklist to read retail liquidity, common mistakes, FAQ and quiz
1. What is retail liquidity?
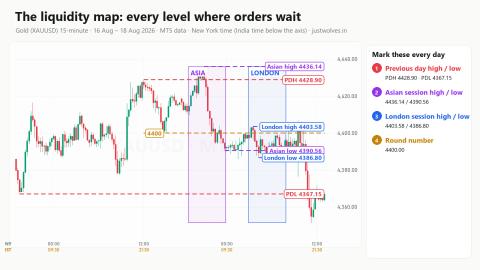
In Lesson 1 you learned that liquidity is orders waiting to be filled: stop losses, breakout entries and pending orders, sitting above highs (buy-side) and below lows (sell-side). Retail liquidity is the part of that pool created by the most popular chart-reading methods.
Think about how a pattern is usually taught:
- Trendline: buy when price touches a rising trendline, with a stop just below the line.
- Double bottom: buy at the second low, with a stop just below both lows.
- Double top: sell at the second high, with a stop just above both highs.
- Support and resistance: buy at support with a stop below it, sell at resistance with a stop above it.
- Range breakout: buy when price breaks above the range, with a stop inside the range.
Each rule is reasonable on its own. The problem is that thousands of traders read the same book, draw the same line and put their stop in the same place. A predictable stop is a predictable pool of orders. When price reaches it, those stops fill all at once, and that burst of orders is exactly the fuel a larger move needs.
2. Trendline liquidity
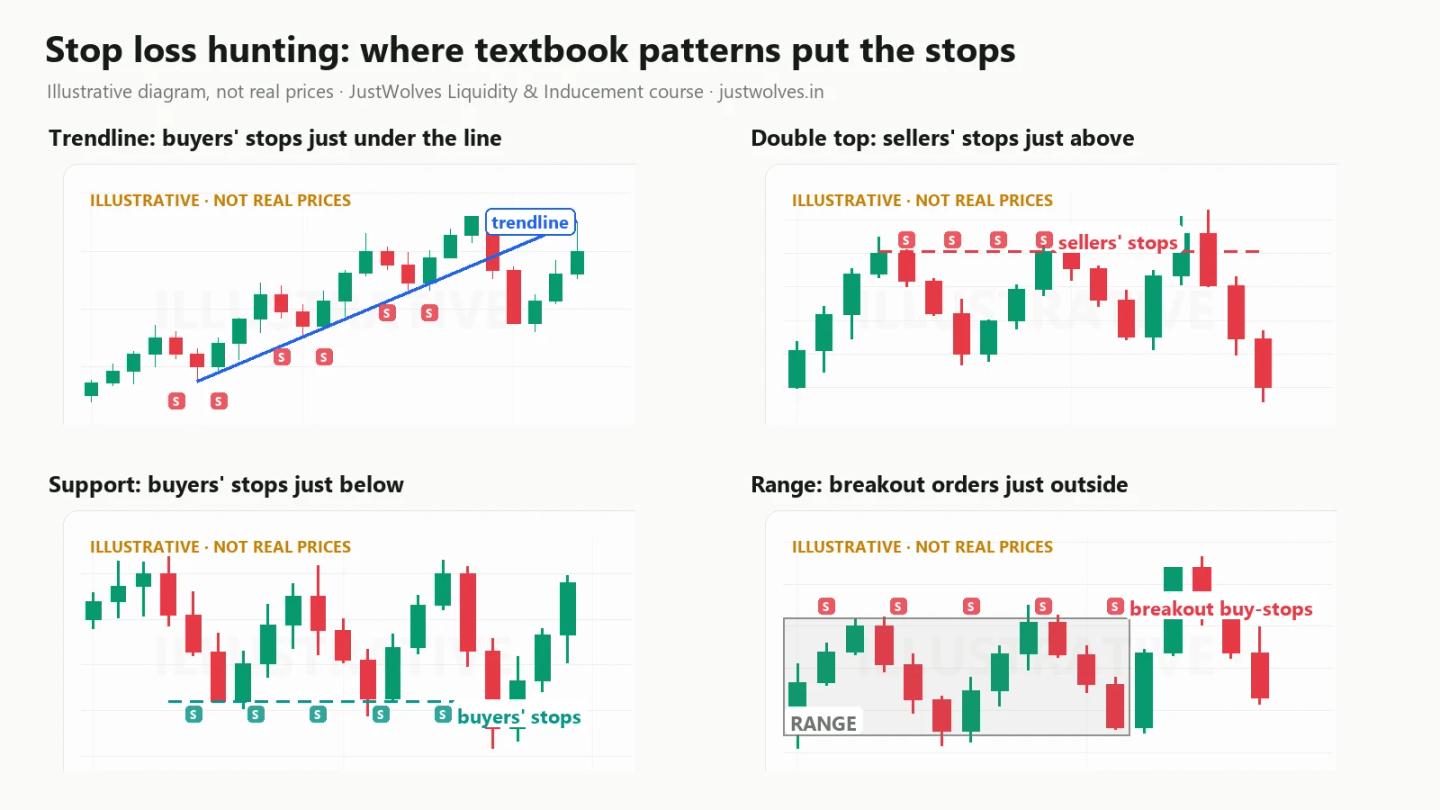
A trendline is the easiest pattern in the world to see, which is exactly why it collects so many orders. Once a rising line has been touched three times, traders who buy each touch put their stops just under it, and breakout sellers wait for price to break below it. Both groups' orders sit in the same narrow band under the line: sell-side liquidity.
2.1 Rising trendline: Wednesday 2 September 2026
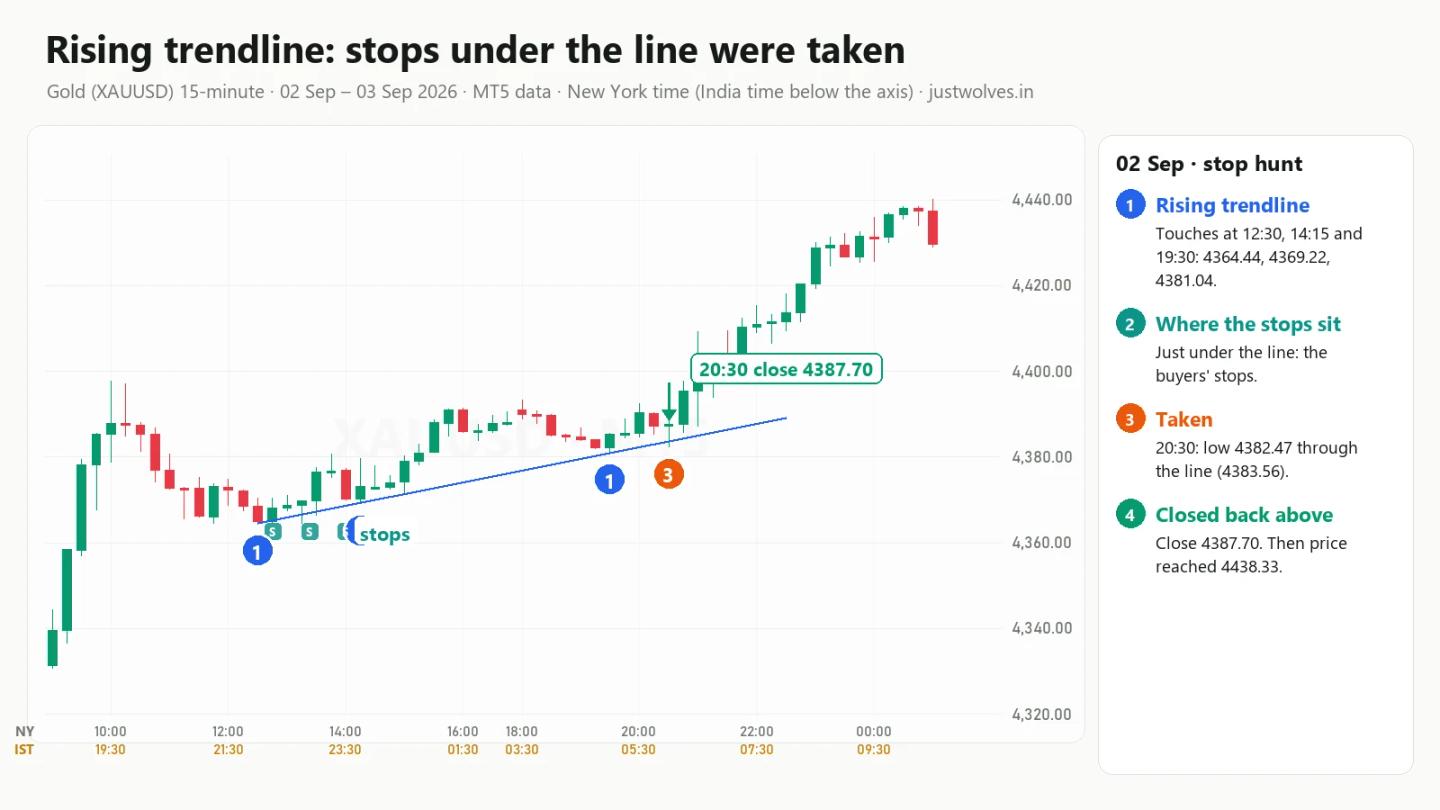
- The line runs through three swing lows: 4364.44 at 12:30, 4369.22 at 14:15 and 4381.04 at 19:30 New York time. The third low sat within 21 cents of the line drawn through the first two, so it is a clean three-touch trendline.
- No candle closed below the line until the break.
- At 20:30 a candle dipped to 4382.47, about $1.09 under the line, which was at 4383.56 at that moment. The stops under the line were filled.
- That candle closed back above the line at 4387.70. In the next four hours not one candle closed below the line, and by 00:30 gold had reached 4438.33, almost $55 higher.
The traders who bought the third touch were stopped out by a dip of about a dollar, just before the move they expected.
Interactive chart: gold 15-minute, 2–3 September 2026 (MT5 data)
Loading historical candles…
2.2 Falling trendline: Thursday 5 November 2026
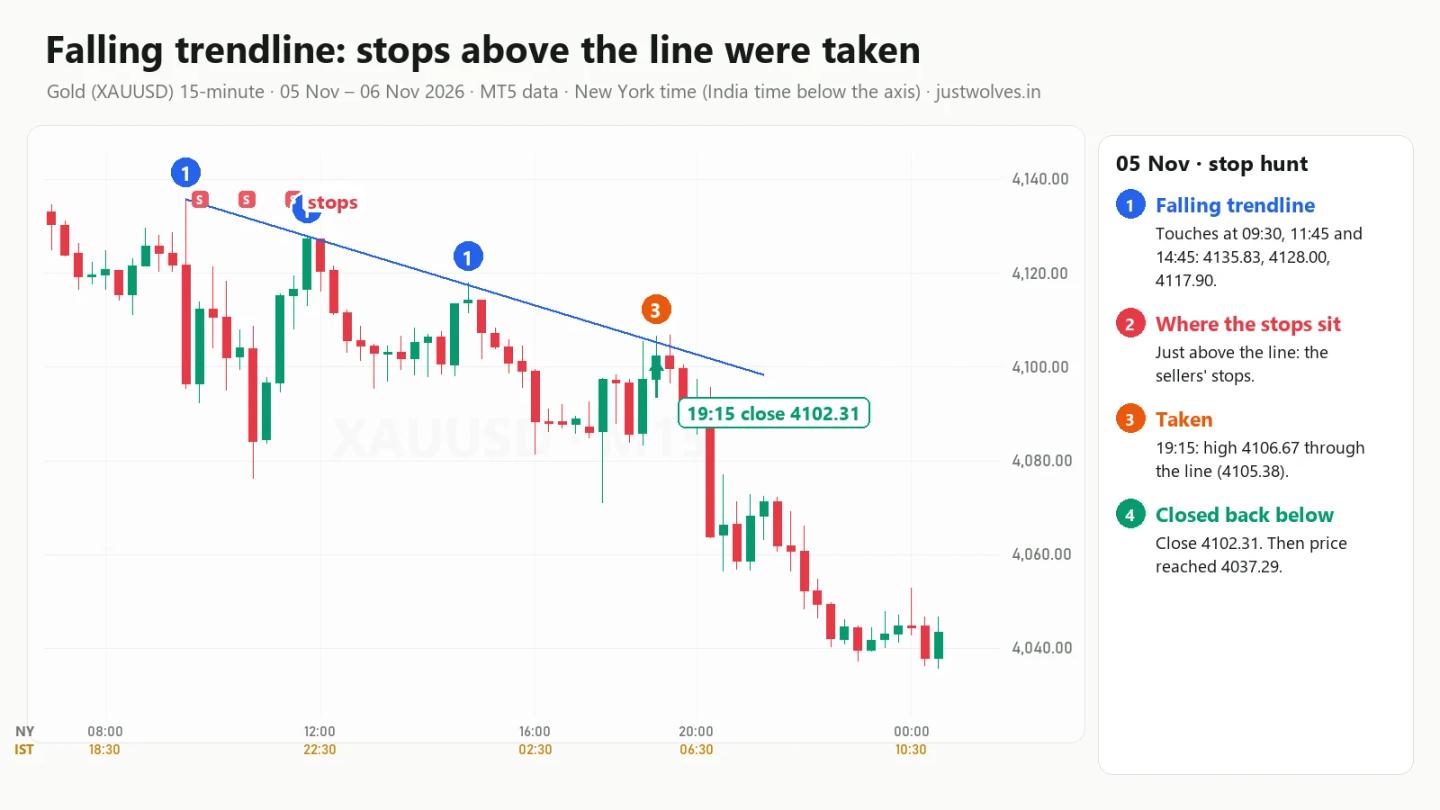
The mirror image: a falling line through swing highs, with sellers' stops and breakout buyers' orders above it (buy-side liquidity).
- Three swing highs: 4135.83 at 09:30, 4128.00 at 11:45 and 4117.90 at 14:45 New York time. The third high was within 34 cents of the line.
- At 19:15 a candle traded up to 4106.67, about $1.29 above the line (4105.38 at that point), and closed back below at 4102.31.
- No candle closed above the line in the next four hours, and by 23:00 gold had fallen to 4037.29, more than $68 lower.
Interactive chart: gold 15-minute, 5 November 2026 (MT5 data)
Loading historical candles…
3. Double tops and double bottoms
A double top is two highs at the same price; a double bottom is two lows at the same price. In Lesson 1 we called them equal highs and equal lows. Retail traders are usually taught to sell the second top with a stop just above both highs, or buy the second bottom with a stop just below both lows. So the area just beyond a double top or bottom is one of the densest pools of retail liquidity on a chart.
For this lesson we only used double tops and bottoms that are clean by strict rules: nothing traded beyond the level in the 12 hours before the first touch, nothing traded beyond it between the two touches, and the break we show is the first trade through it.
3.1 Double top: Thursday 19 February 2026
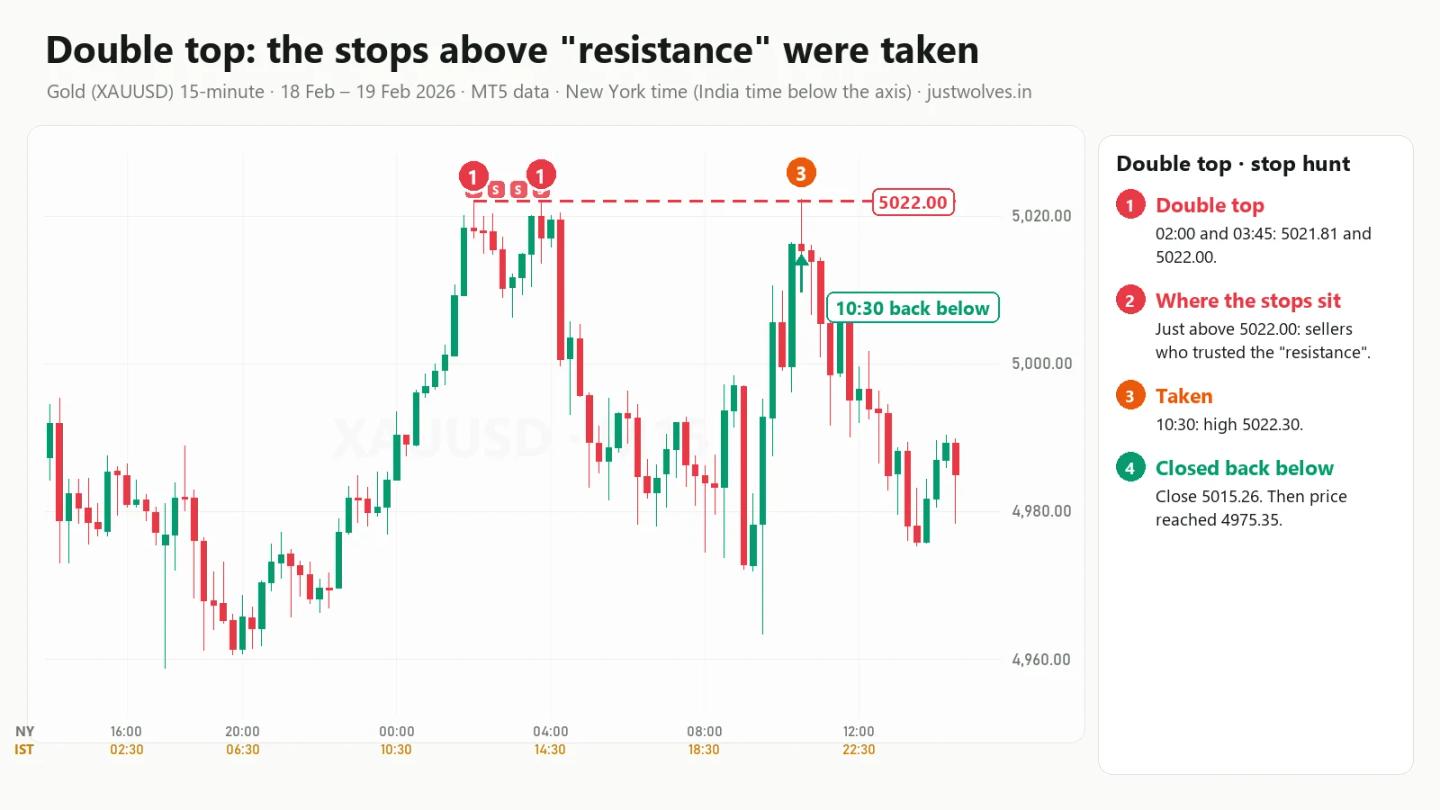
- Two highs during the London morning: 5021.81 at 02:00 and 5022.00 at 03:45, just 19 cents apart. In the 12 hours before, gold had not traded above 5020.06.
- Textbook sellers sold the second top with stops just above 5022.
- At 10:30 New York time a candle traded to 5022.30, only 30 cents above the double top. That was enough to trigger stops placed right above it.
- The candle closed back below at 5015.26. No candle closed above 5022.00 in the next four hours, and by 13:30 gold had fallen to 4975.35, about $47 lower.
Notice how small the run above the level was. Stops placed one or two dollars above an obvious high can be hit by a move that barely shows on a chart.
3.2 Double bottom: Monday 30 March 2026
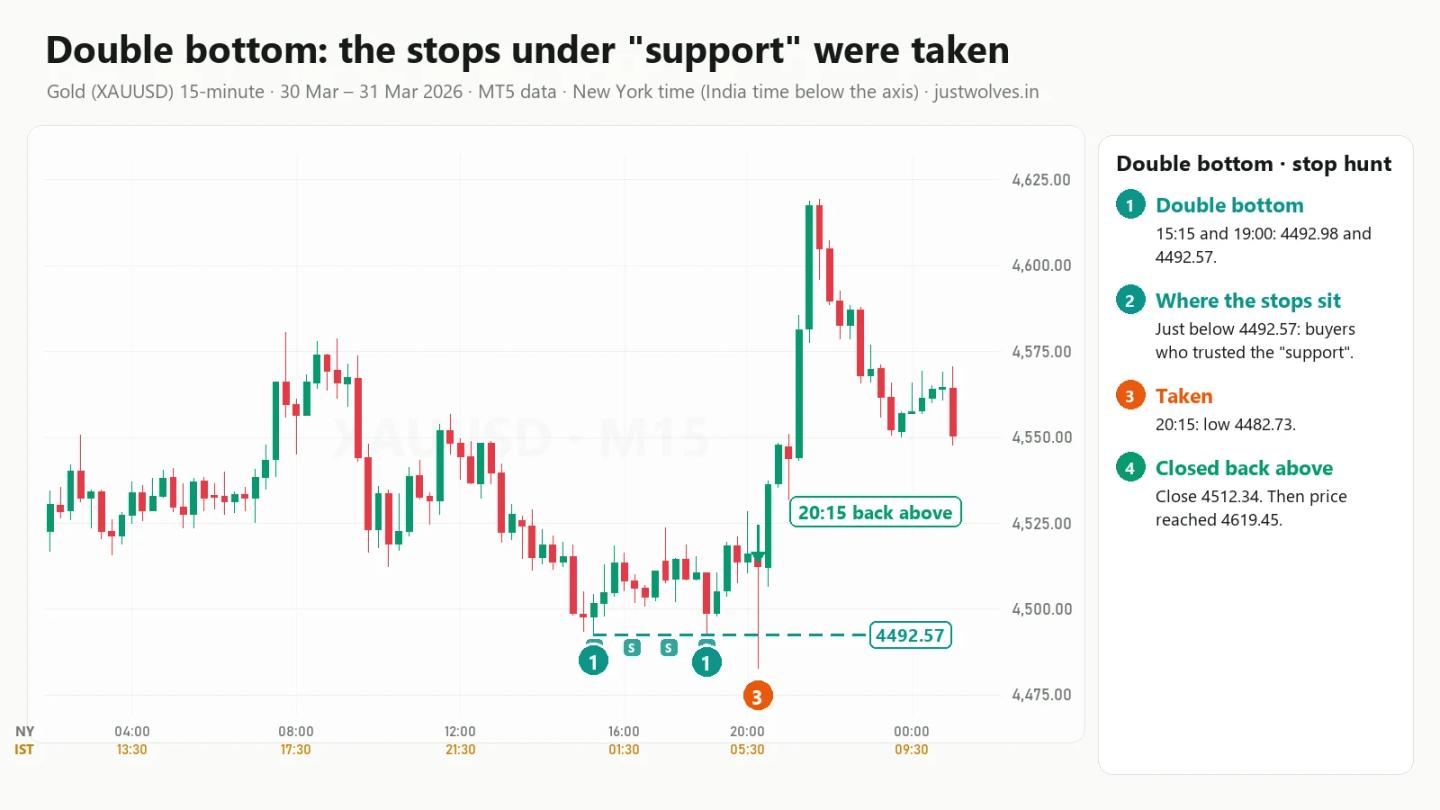
- Two lows: 4492.98 at 15:15 and 4492.57 at 19:00, 41 cents apart. In the 12 hours before the first low, gold had not traded below 4493.45.
- Textbook buyers bought the second bottom with stops just below 4492.
- At 20:15 a candle dropped to 4482.73, about $9.84 below the double bottom, filling those sell stops, and closed back above at 4512.34.
- By 21:45, only an hour and a half later, gold had reached 4619.45, almost $127 above the double bottom.
4. Support and resistance: why "strong" levels attract price
Support and resistance are the most taught ideas in trading, and the most misunderstood. A level becomes "strong" in a trader's eyes because price has respected it before. But every time it is respected, more traders lean on it, and more stops pile up just beyond it.
That creates a paradox: the stronger a level looks, the more liquidity sits behind it, and the more attractive it becomes as a target. The double top and double bottom above are support and resistance in their purest form. In each case the "strong" level held until the moment its stops were collected, and then price moved hard the other way.
A practical way to think about it:
- Support is not a floor. It is a place where buy orders sit above and sell stops sit below.
- Resistance is not a ceiling. It is a place where sell orders sit below and buy stops sit above.
- The more touches a level has, the more stops are likely to sit beyond it.
For a refresher on how support and resistance are drawn, see our support and resistance lesson.
5. Range breakouts, false breakouts and liquidity grabs
A range is a period where price moves sideways in a tight box. Breakout traders wait above the top of the box with buy-stop orders, and below the bottom with sell-stop orders. Range traders sell the top and buy the bottom, with stops just outside. So a quiet range has liquidity waiting on both sides.
When price breaks out and keeps going, breakout traders win. When it breaks out, fills those orders and falls back inside, that is a fake breakout, and the breakout traders' orders were the liquidity.
5.1 Fake breakout: Tuesday 28 July 2026
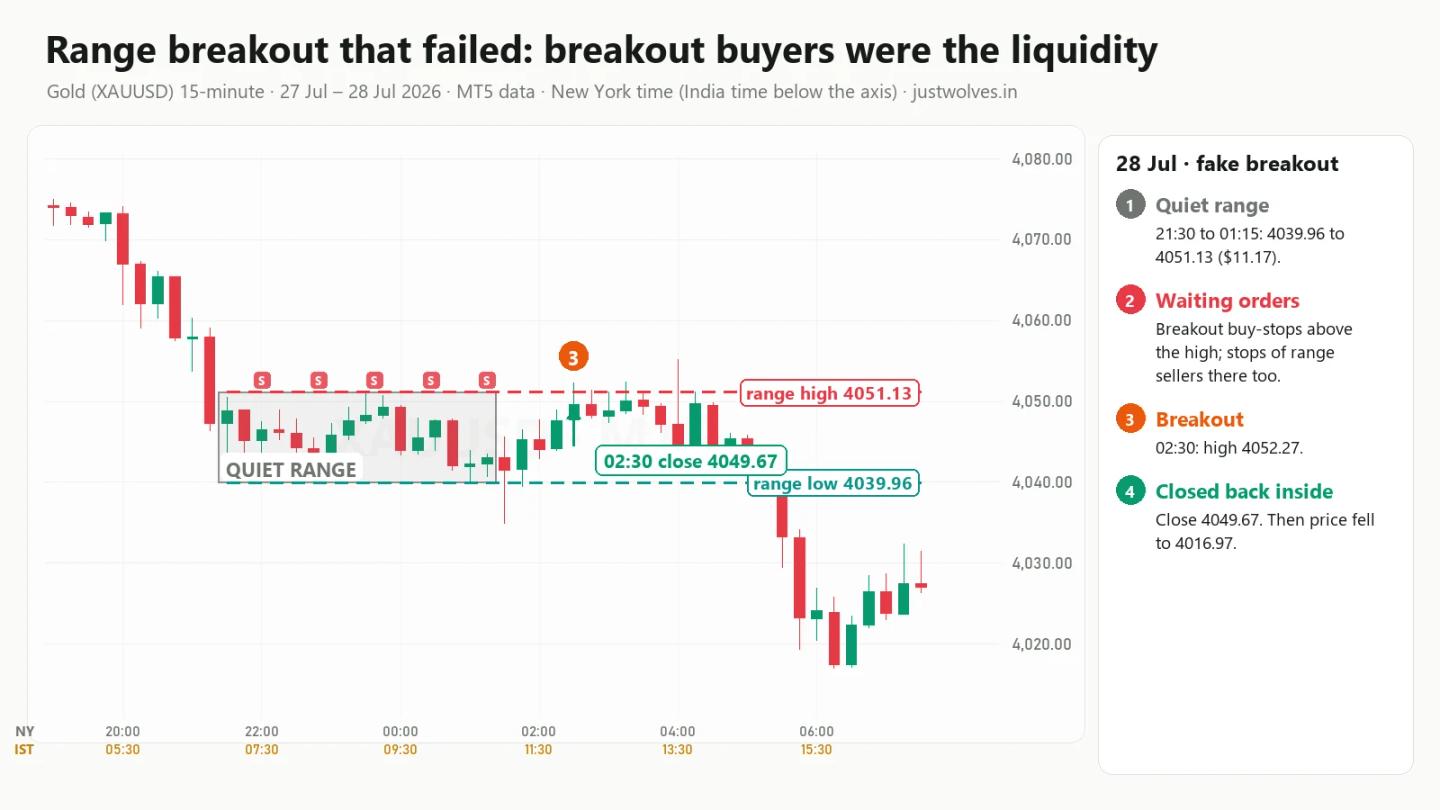
- From 21:30 to 01:15 New York time (16 candles) gold moved in a box only $11.17 tall: high 4051.13 at 23:30, low 4039.96 at 01:00.
- At 02:30, just before the London session, a candle traded up to 4052.27, breaking the top of the range by about a dollar. Breakout buyers were filled.
- The candle closed back inside the range at 4049.67. No candle closed above the range high in the next four hours.
- By 06:15 gold had dropped to 4016.97, through the bottom of the range and $34 below its high.
Interactive chart: gold 15-minute, 27–28 July 2026 (MT5 data)
Loading historical candles…
6. When the breakout is real: Tuesday 14 July 2026
Every example so far has the same shape: price runs just beyond a retail level, fills the stops and closes back inside. But many breakouts are real. Here is one, and it matters because it looks almost identical at the moment of the break.
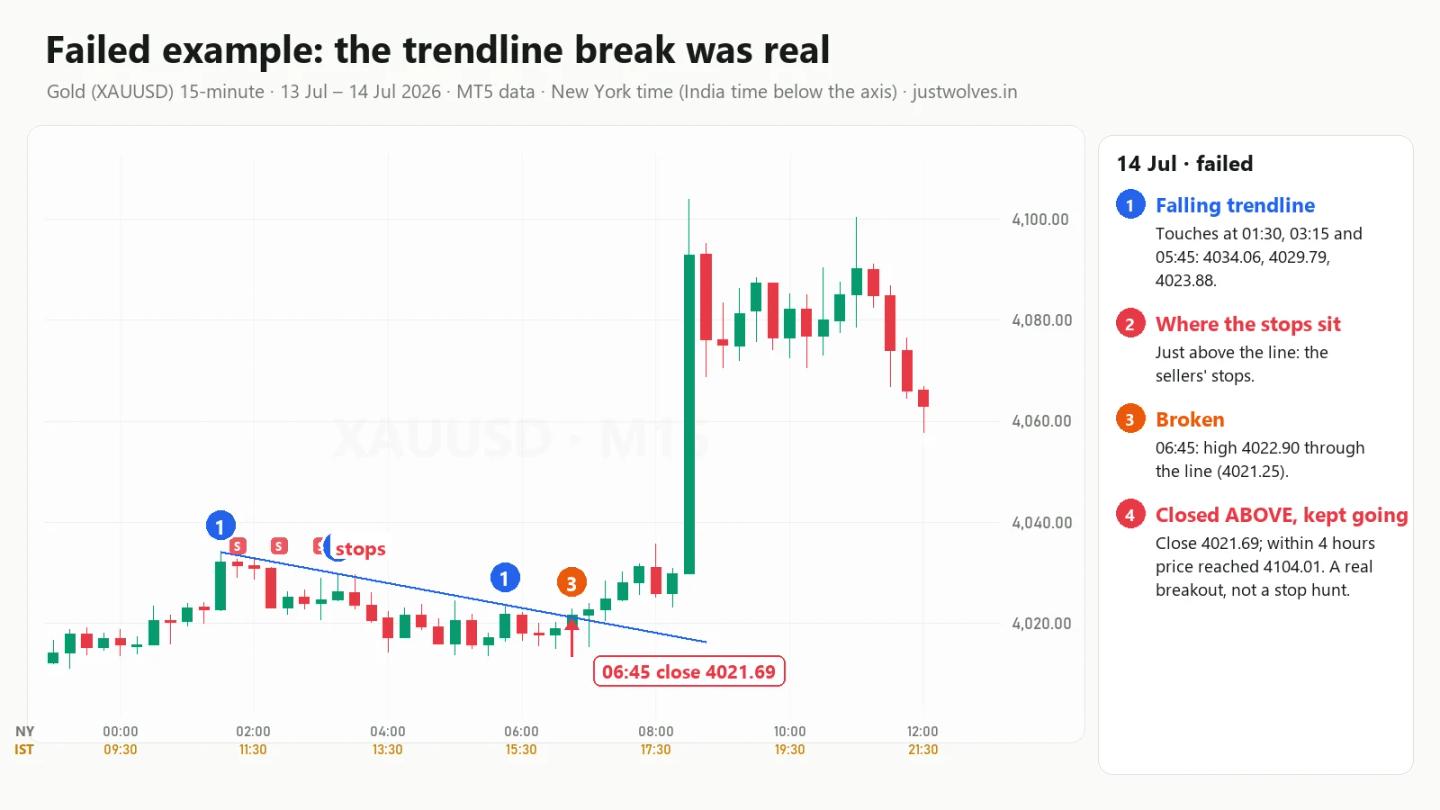
- A falling trendline through three swing highs: 4034.06 at 01:30, 4029.79 at 03:15 and 4023.88 at 05:45 New York time.
- At 06:45 a candle traded up to 4022.90 and closed above the line at 4021.69. The close was only 44 cents above the line, so at that moment it looked like any other poke above a trendline.
- The difference came next: all 16 of the following candles closed above the line. There was no close back inside.
- By 08:30 gold had reached 4104.01, more than $82 above the trendline. That high became the previous week high you saw in Lesson 1, section 4.4.
What to learn from it: a single candle breaking a retail level tells you very little. What happens over the next few candles tells you much more. Closing back inside the level points to a liquidity grab; closing beyond it and staying there points to a real breakout. Big scheduled news can also turn a small break into a large move, so always know what is on the economic calendar before you trade around a retail level.
Interactive chart: gold 15-minute, 14 July 2026 (MT5 data)
Loading historical candles…
Retail liquidity cheat sheet
| Pattern | Where the crowd's stops sit | Liquidity type | What a grab looks like |
|---|---|---|---|
| Rising trendline | Just below the line | Sell-side | Dip below the line, close back above |
| Falling trendline | Just above the line | Buy-side | Poke above the line, close back below |
| Double top | Just above both highs | Buy-side | Trade above the highs, close back below |
| Double bottom | Just below both lows | Sell-side | Trade below the lows, close back above |
| Resistance | Just above the level | Buy-side | Run above, close back below |
| Support | Just below the level | Sell-side | Run below, close back above |
| Range | Above the high and below the low | Both | Break out, close back inside the range |
How to read retail liquidity: a five-step checklist
- Draw the pattern the way the textbook does. Trendline through three touches, double top or bottom, the range box, the obvious support or resistance.
- Mark where the crowd's stops are. Just beyond the line, the two highs or lows, or the range.
- Wait for price to reach that pool. Do nothing before then.
- Watch the close of the candle that goes through. Back inside points to a grab; beyond points to a possible real break.
- Watch the next few candles. On 14 July all 16 closed beyond the line; in the other five examples none did.
Common mistakes with retail liquidity
- Assuming every break is fake. The 14 July example broke a trendline and ran more than $82. Retail liquidity tells you where the stops are, not what happens after they are taken.
- Putting your own stop in the textbook spot. If your stop is exactly where the book says, it is part of the pool.
- Drawing lines loosely. A trendline with touches several dollars away from the line is not a level the crowd agrees on. Our examples use touches within about 35 cents of the line.
- Ignoring the size of the run. On 19 February the run above the double top was only 30 cents. Small runs are enough to trigger stops placed right at a level.
- Forgetting the calendar. A scheduled economic release can turn a small break into a large move in minutes.
Homework
Open a 15-minute gold chart and find one example of each: a three-touch trendline, a double top or bottom, and a quiet range. For each one, write down where the crowd's stops would be, then scroll forward and note whether the first break closed back inside or closed beyond and kept going.
Practise on the live gold chart
● LiveFrequently Asked Questions
What is retail liquidity in trading?
It is the pool of stop losses and breakout orders created by the patterns most traders learn first, such as trendlines, double tops and bottoms, support and resistance, and range breakouts.
Why do trendline breaks so often fail?
Because many traders put their stops just beyond the same line. Price can reach those stops with a small move, fill them and return. On 2 September and 5 November 2026, gold broke a three-touch trendline by about a dollar and then moved more than $50 the other way.
Is a double top a sell signal?
Not on its own. A double top tells you where buy stops are likely to sit: just above the highs. On 19 February 2026 a run of only 30 cents above a double top filled those stops before gold fell almost $47.
How can I tell a fake breakout from a real one?
Watch the close of the breakout candle and the candles after it. A close back inside the range or pattern points to a liquidity grab. A close beyond it, followed by more closes beyond, points to a real breakout, as on 14 July 2026.
Should I stop using support and resistance?
No. Keep using them to see where orders are likely to be. Just remember that the area beyond a well-known level is also where many stops sit.
Test Your Knowledge
Where do textbook traders usually put their stop when buying at a rising trendline?
Related lessons
Education only. Not investment advice or a recommendation to trade. JustWolves is not a SEBI-registered adviser. Charts use historical MT5 chart data picked to explain a concept; they are not a record of real trades. Trading forex and commodities involves substantial risk of loss.