Inducement in Trading: Why the First Pullback Is Bait
JustWolves is an educational platform and is not a SEBI-registered investment advisor. Trading financial instruments involves significant risk of loss and may not be suitable for all investors. Past performance is not indicative of future results. Read our full disclaimer →

What you'll learn
- Inducement is a level that invites early entries; the stops behind it become liquidity.
- The first pullback after a strong move is the most common form of inducement.
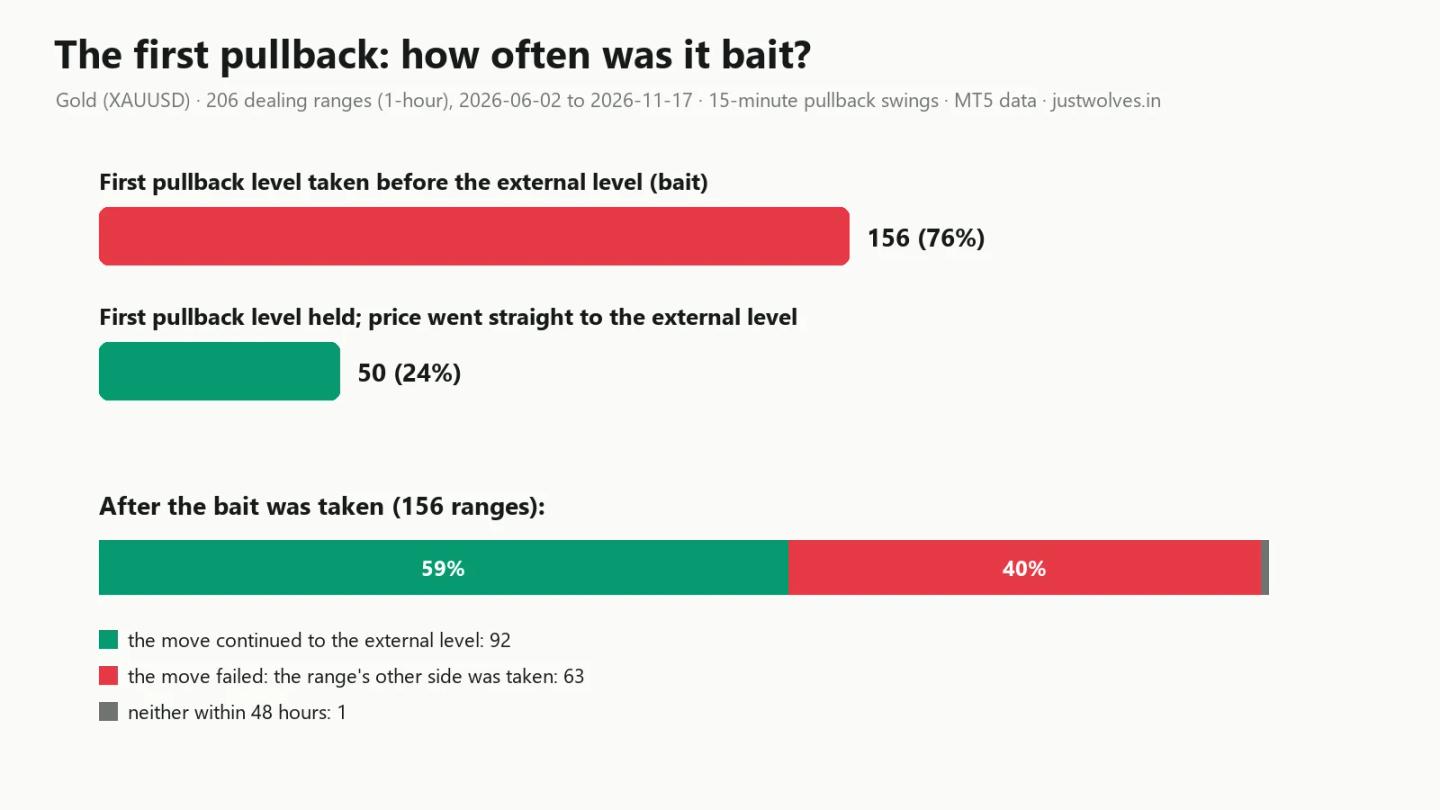
- In 206 gold dealing ranges, the first pullback level was taken before the external level 76% of the time.
- After the bait was taken, the move still reached the external level 59% of the time and failed 40% of the time.
- Do not place your stop at the obvious first-pullback level; treat it as a target and read the reaction when it is taken.
In this article · 13 sections
Inducement in trading starts from a simple observation: the first place traders want to join a move is also the first place their stops get taken. After a strong move, the first small pullback invites early buyers (or sellers), and their stops sit just beyond it. This lesson defines that first pullback precisely, counts how often it was taken in 206 gold dealing ranges (MetaTrader 5 data, June to November 2026), and then looks at four real charts: two where the bait was taken and the move continued, one where it held, and one where the move failed.
What you will learn
- What inducement means
- Why the first pullback is bait
- How we mark the first pullback
- How often the first pullback was taken in 206 real cases
- Real chart: bullish inducement, 2 September 2026
- Real chart: bearish inducement, 10–11 November 2026
- When there is no bait: 19 August 2026
- When the bait is taken and the move fails: 4–6 November 2026
- How to use inducement, common mistakes, FAQ and quiz
1. What inducement means in trading (SMC)
Inducement is a level that invites traders to act too early. They see what looks like a good entry, take it, and put their stop loss just beyond a nearby swing. That stop then becomes liquidity, in exactly the sense you learned in Lesson 1: an order waiting to be filled.
When price takes that liquidity before the real move, the early traders are stopped out, and the move often continues without them. Traders call it bait: it looks like an opportunity, but it mostly provides fuel.
You have already met a form of inducement. In Lesson 2, the textbook trendline and double-bottom stops were taken before the move went the other way. In this lesson we look at a more specific case: the first pullback after a strong move.
2. Why the first pullback is bait
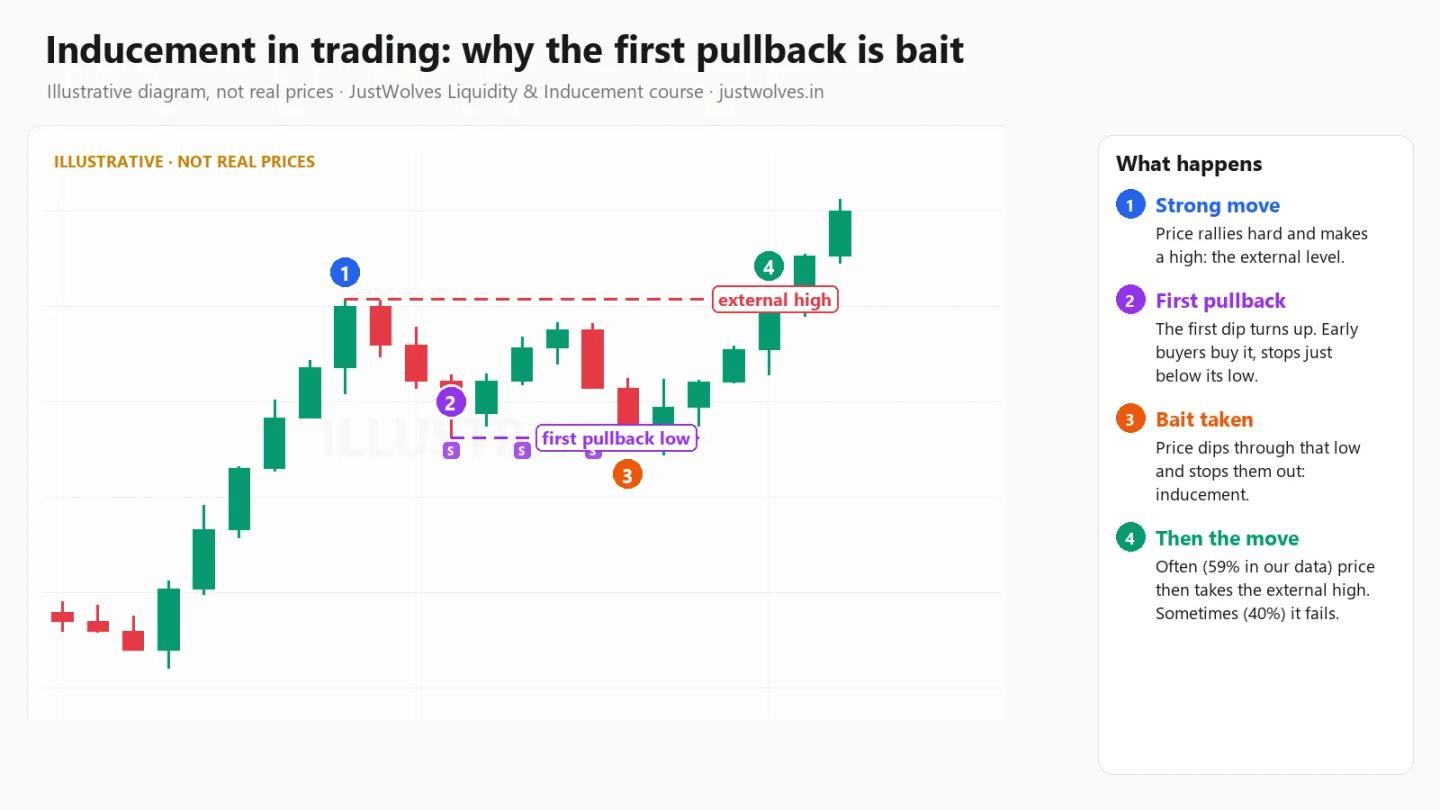
Take a strong rally. Traders who missed it are waiting for any dip to buy. The first time price pulls back and turns up again, it forms a small swing low, and that is where many of them buy, with stops just below it.
That creates a small but concentrated pool of sell-side liquidity very close to price:
- it is near: only a few dollars below the current price;
- it is obvious: everyone watching the move can see the same first dip;
- it is early: the main targets, the internal gaps of Lesson 3 and the deeper discount of the range, are still further away.
So the first pullback low is often the first liquidity price reaches on the way to a deeper pullback. Once it is taken, the early buyers are out, and the move can resume. In a falling market the same happens with the first pullback high and early sellers.
3. How we mark the first pullback
To measure inducement, every step needs a fixed rule:
- Mark the dealing range on the 1-hour chart, exactly as in Lesson 3: a confirmed swing where the move started, a confirmed swing where it ended, and a move of at least three times the hourly ATR.
- Find the extreme on the 15-minute chart: the 15-minute candle that made the range high (in a bullish range) or the range low (in a bearish one).
- Find the first pullback swing: the first confirmed 15-minute swing low after that high (two higher lows on each side), or the first swing high after the low in a falling move. This is the inducement level.
- Follow price for up to 48 hours and record which comes first:
- the inducement level is traded through (the bait was taken), or
- price goes beyond the range extreme, taking the external liquidity (no bait).
4. How often the first pullback was taken in 206 real cases
| What happened to the first pullback level | Ranges | Share |
|---|---|---|
| Taken before the external level (the bait was taken) | 156 | 76% |
| Held, and price went straight to the external level | 50 | 24% |
| After the bait was taken (156 ranges) | Ranges | Share |
|---|---|---|
| The move continued to the external level anyway | 92 | 59% |
| The move failed: the range's other side was taken | 63 | 40% |
| Neither within 48 hours | 1 | under 1% |
Gold (XAUUSD), 1-hour dealing ranges with 15-minute pullback swings, MT5 data. This describes what happened; it is not a set of trading rules.
Two things to take from this:
- A stop just beyond the first pullback was usually hit. In three cases out of four, price traded through the first pullback level before reaching the external target. That held in both directions: 80 of 101 bullish ranges and 76 of 105 bearish ones.
- Taking the bait did not usually end the move. After the first pullback level was taken, the move still reached the external level in 59% of cases. So the traders stopped out at the first pullback were often right about the direction and wrong only about the entry.
5. Real chart: bullish inducement, Wednesday 2 September 2026
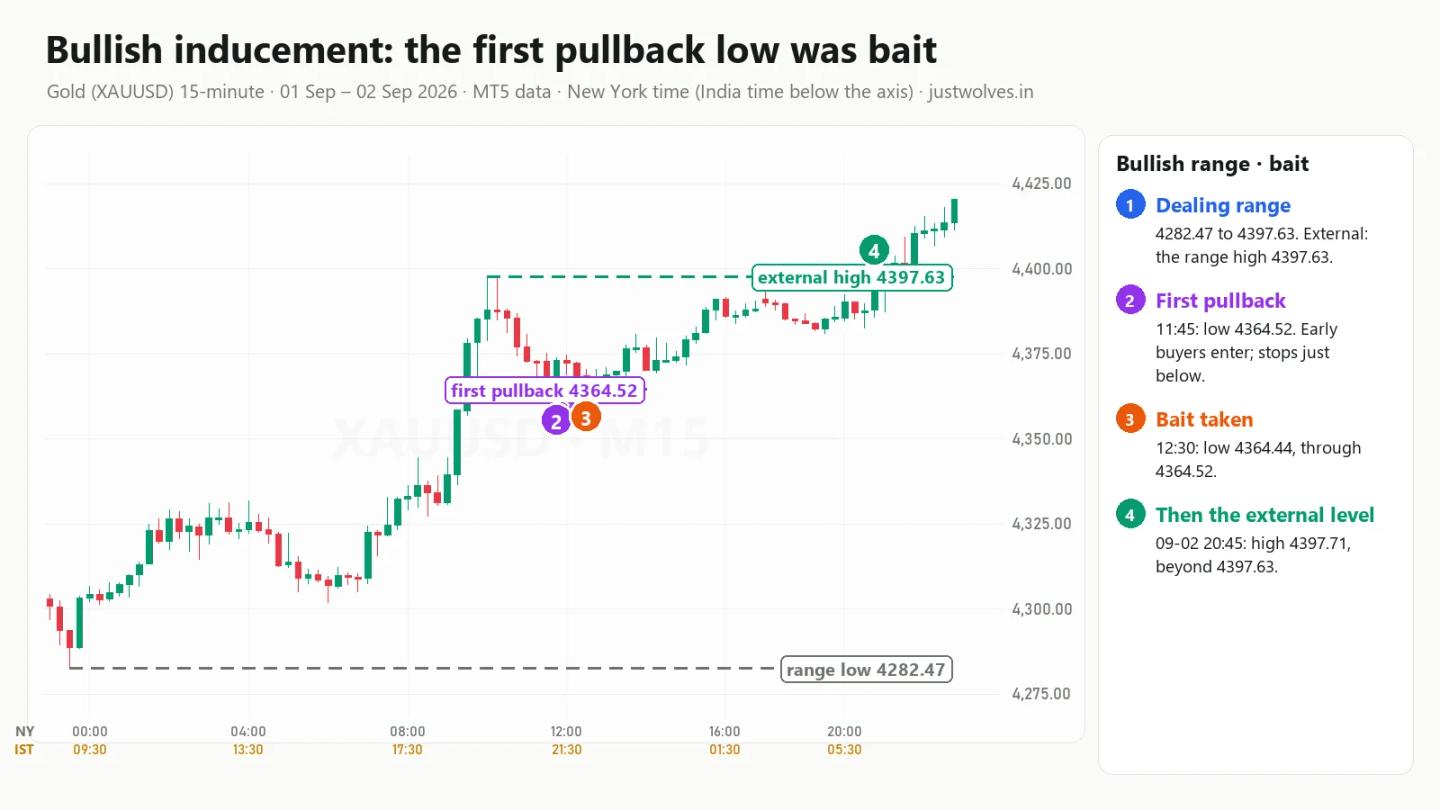
- The range. A bullish dealing range from 4282.47 (the 23:00 hourly candle on 1 September) to 4397.63 (10:00 on 2 September).
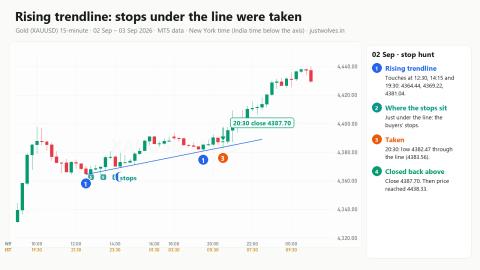
- The first pullback low. After the high, price dipped and formed its first 15-minute swing low at 4364.52 at 11:45 New York time. Early buyers would buy there, with stops just below.
- The bait. At 12:30 a candle traded down to 4364.44, just 8 cents below that low, and closed at 4364.92. That small move was enough to trigger stops placed right under the swing.
- What followed. Price never traded lower than 4364.44 again in this move. At 20:45 it traded to 4397.71, above the range high, and in Lesson 2 you saw it carry on to 4438.33 by 00:30.
The 12:30 candle will look familiar: it was also the first touch of the rising trendline in Lesson 2, section 2.1. The same low was both the first touch of a textbook trendline and the bait under the first pullback.
6. Real chart: bearish inducement, 10–11 November 2026
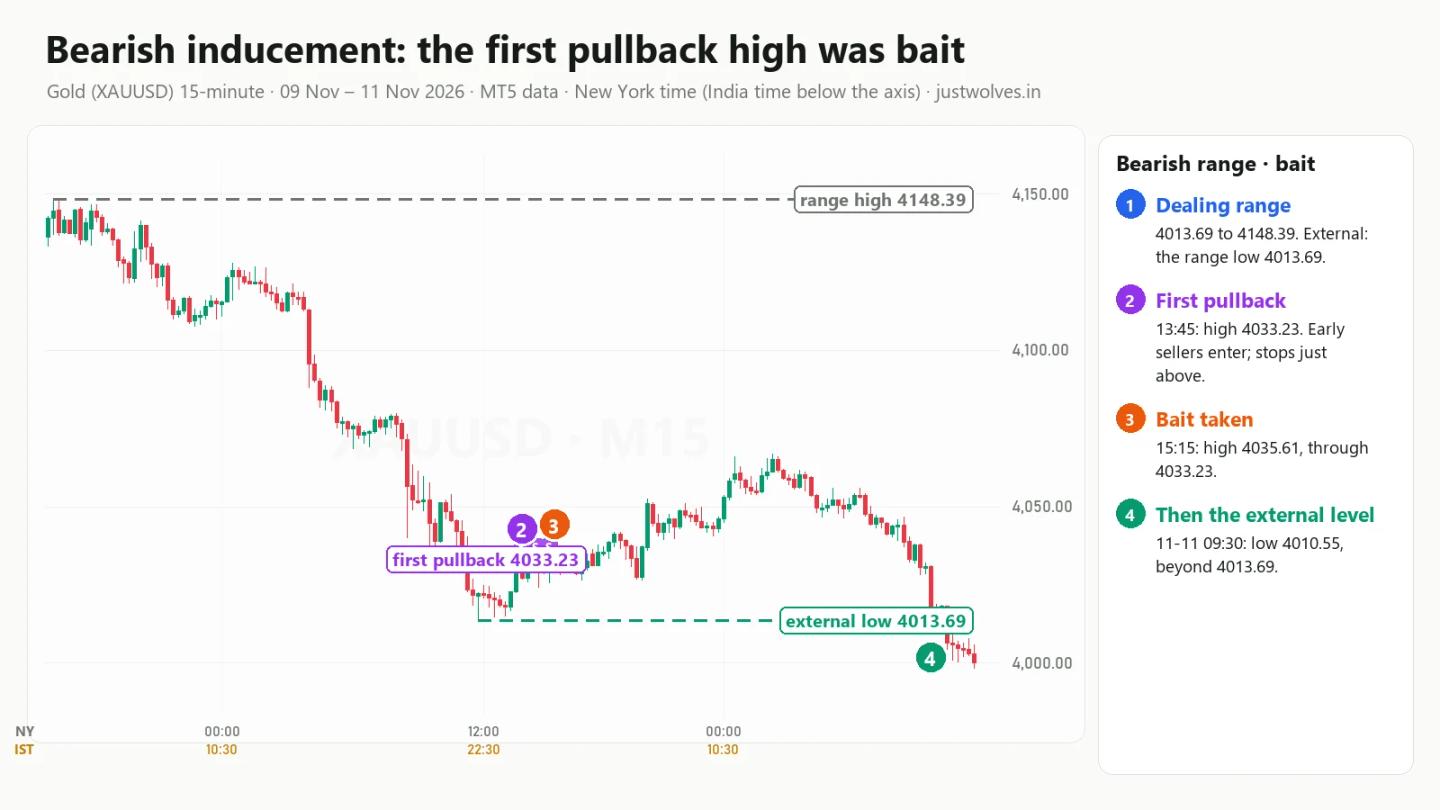
This is the same bearish dealing range as Lesson 4, section 7.
- The range. From 4148.39 (15:00 on 9 November) down to 4013.69 (the 11:45 candle on 10 November).
- The first pullback high. The first 15-minute swing high after the low formed at 4033.23 at 13:45. Early sellers would sell there, with stops just above.
- The bait. At 15:15 a candle traded up to 4035.61, about $2.38 above that high. The early sellers' stops were filled.
- What followed. Price kept pulling back for a while, reaching 4066.88 at 02:15 on 11 November (the internal liquidity of Lesson 4's stage 1). Then the fall resumed, and at 09:30 price traded to 4010.55, below the range low. In Lesson 4 you saw it carry on to 3852.37 the next day.
Sellers who shorted the first pullback at 4033 with a tight stop were stopped out; sellers who waited for the deeper pullback sold far higher, before the same move lower.
7. When there is no bait: Wednesday 19 August 2026
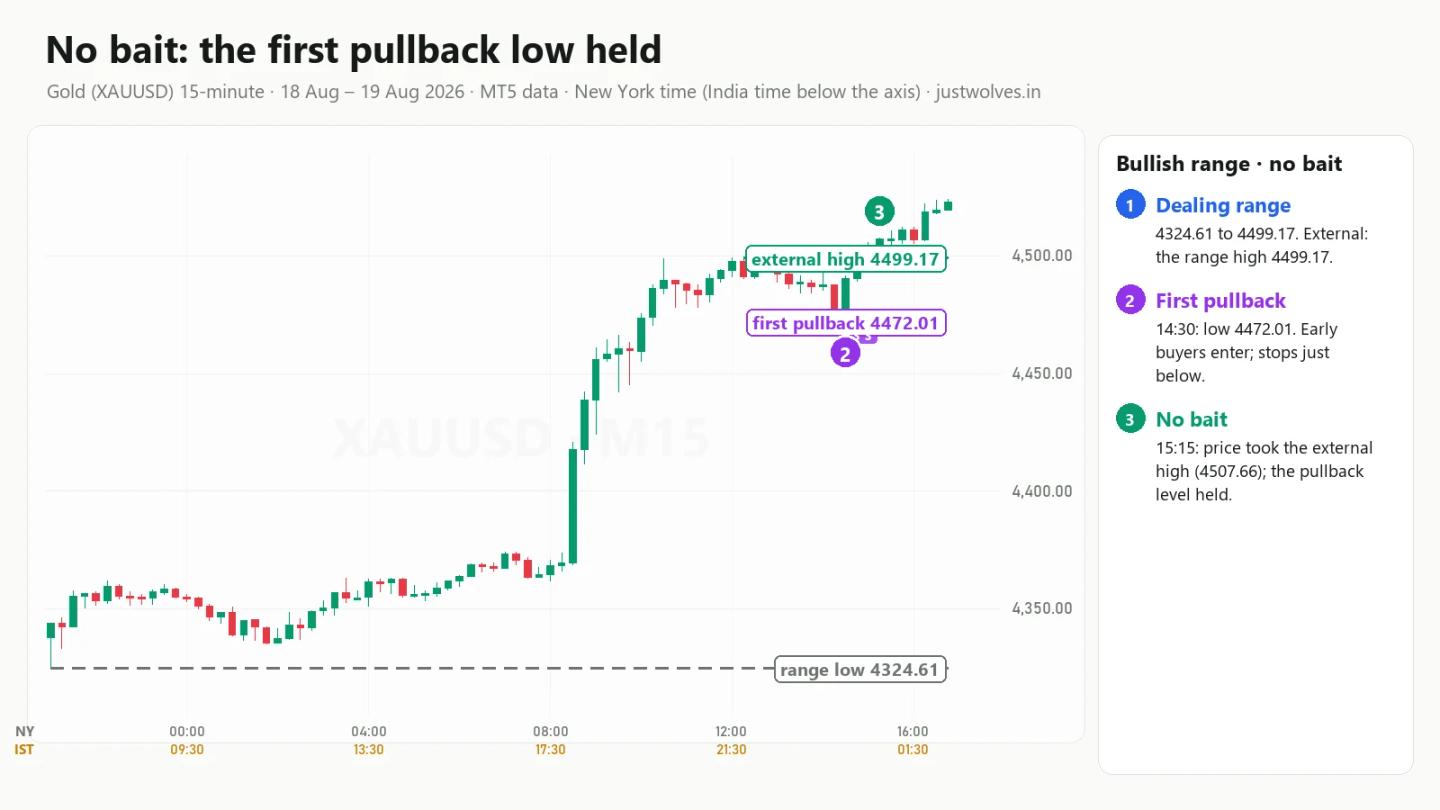
This is the bullish dealing range from Lessons 3 and 4.
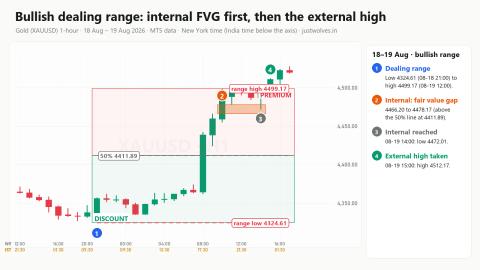
- The range. From 4324.61 to 4499.17, the high made by the 12:15 candle on 19 August.
- The first pullback low. 4472.01 at 14:30, the same pullback that reached the internal gap in Lesson 3.
- What happened. The first pullback low was not taken. At 15:15 price traded up to 4507.66, above the range high.
This was one of the 50 ranges (24%) where the first pullback held. In strong moves, the first dip can be the only dip. That is the cost of waiting for bait: sometimes it never comes.
8. When the bait is taken and the move fails: 4–6 November 2026
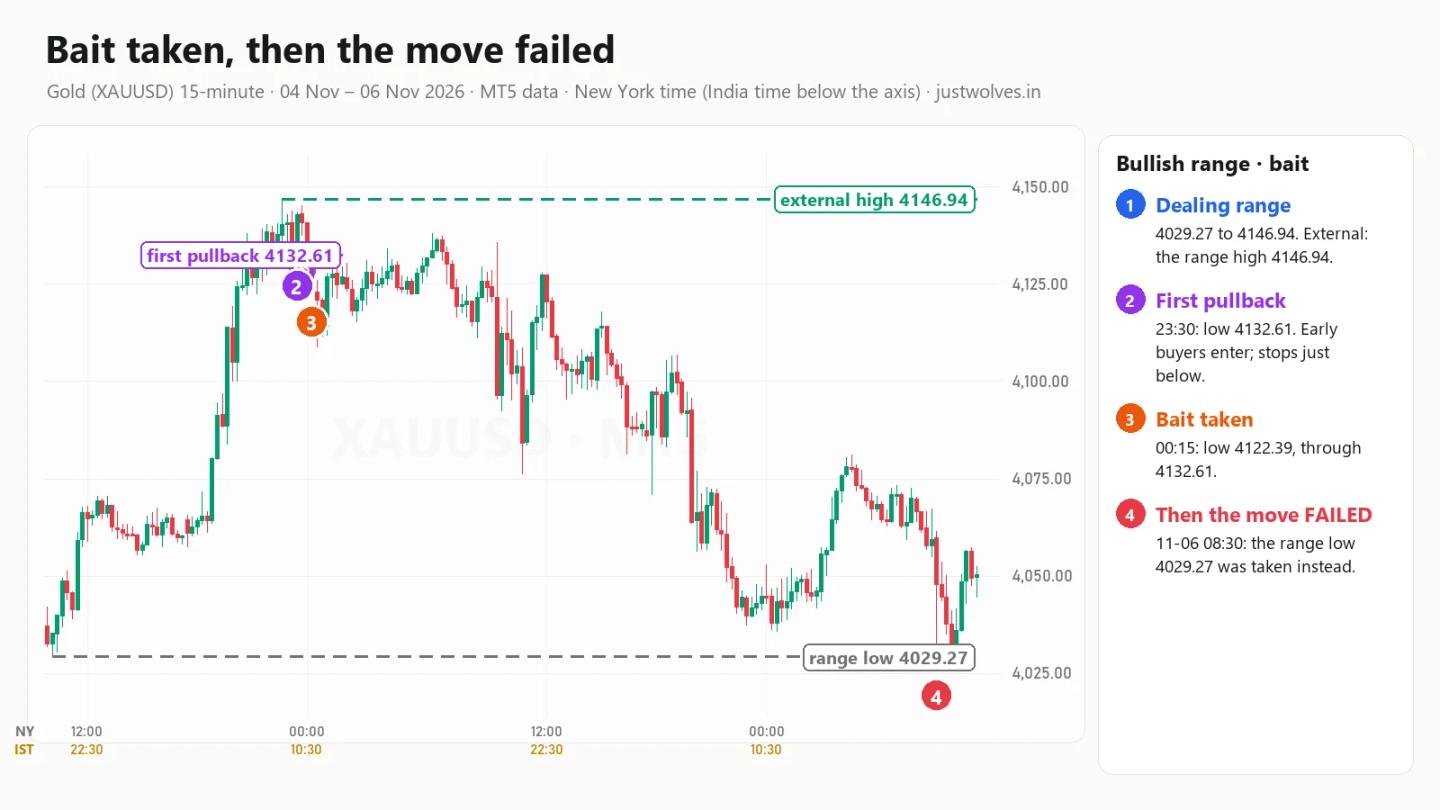
This is the failed dealing range from Lesson 3, section 7.2.
- The range. A bullish range from 4029.27 to 4146.94, the high made by the 22:45 candle on 4 November.
- The first pullback low. 4132.61 at 23:30.
- The bait. At 00:15 on 5 November a candle fell to 4122.39 and closed at 4122.93, taking the stops under the first pullback.
- What followed. Price never got back above the range high. Instead it kept making lower highs (Lesson 2's falling trendline formed during this decline) and at 08:30 on 6 November it fell to 4026.21, below the range low.
This is one of the 63 ranges (40% of the bait cases) where taking the bait was the start of a failure. From the bait alone, you could not tell this case from 2 September. The difference showed up later, in the reaction (Lesson 6) and in the structure, which Lesson 11 covers.
9. How to use inducement
- Do not place a tight stop just beyond the first pullback. In our sample that level was taken three times in four.
- Treat the first pullback level as liquidity, not as support. Mark it on your chart as a likely target.
- Let the bait be taken, then read the reaction. Use the sweep, run and trap reactions from Lesson 6 on the candle that takes it.
- Look for a deeper area to act from. The internal gaps and the discount (or premium) half of the range from Lesson 3 are where the move resumed in our examples.
- Plan for the failure. Two in five bait cases ended with the other side of the range taken. Size every trade so that is affordable: see our position sizing lesson.
Common mistakes with inducement
- Buying the first dip with a tight stop. Your stop becomes the bait.
- Assuming the bait is always taken. In 24% of our ranges the first pullback held and price went straight to the target.
- Assuming the move must continue after the bait. In 40% of bait cases the range's other side was taken.
- Measuring the first pullback on the wrong timeframe. Use one fixed rule (here: 1-hour range, 15-minute swing) or the results become guesswork.
- Ignoring how small the bait can be. On 2 September it was 8 cents.
Homework
Find three recent 1-hour dealing ranges on gold. For each, mark the first 15-minute pullback swing after the range extreme. Note whether it was taken before the external level and, if it was, what happened next. Compare your three cases with the tables in section 4.
Practise on the live gold chart
● LiveFrequently Asked Questions
What is inducement in trading?
A level that invites traders to enter early, usually a small swing close to price. Their stop losses become liquidity, and price often takes that liquidity before the real move.
Why is the first pullback a trap?
Because many traders buy the first dip after a strong move and place stops just below it. In our 206 gold ranges, that first pullback level was taken before the external target 76% of the time.
Does taking the inducement mean the move is over?
No. After the first pullback level was taken, the move still reached the external level in 59% of our cases. It failed in 40%.
Where should I place my stop instead?
Beyond a level that price is less likely to reach on a normal pullback, such as beyond the deeper internal liquidity or the range itself, with a position size that keeps the risk small. This course's later lessons and our stop loss lesson cover stop placement in detail.
Is inducement the same as a liquidity sweep?
They are related. Inducement describes why the liquidity is there (early entries with nearby stops); a sweep describes how price reacts after taking it (Lesson 6).
Test Your Knowledge
What is inducement?
Related lessons
Education only. Not investment advice or a recommendation to trade. JustWolves is not a SEBI-registered adviser. Charts and statistics use historical MT5 chart data for gold from 2 June to 17 November 2026; they describe past behaviour in one market and period and are not a forecast or a record of real trades. Trading forex and commodities involves substantial risk of loss.