Higher Timeframe Bias: Does a 15-Minute Sweep Hold on the Daily Chart?
JustWolves is an educational platform and is not a SEBI-registered investment advisor. Trading financial instruments involves significant risk of loss and may not be suitable for all investors. Past performance is not indicative of future results. Read our full disclaimer →
What you'll learn
- Multiple timeframe analysis for liquidity means reading the same take on more than one chart, and knowing which question each chart answers.
- In 429 gold takes, the day closed beyond the level after 61% of 15-minute runs and back inside after 69% of 15-minute sweeps.
- About two runs in five became daily wicks, and almost one sweep in three became a daily close beyond the level.
- Bigger levels reversed only slightly more often than session levels; use them to frame the week, not as automatic reversal points.
- Work top-down (daily, 1-hour, 15-minute), and match how long you hold to the timeframe of your signal.
In this article · 12 sections
Higher timeframe bias comes from multiple timeframe analysis: reading the same market on more than one chart, usually a higher timeframe for direction and a lower one for timing. For liquidity traders it answers a simple question: when price takes a level and you see a clean breakout on the 15-minute chart, what does that same moment look like on the daily chart? This lesson measures it on 429 real liquidity takes on gold (XAUUSD) from MetaTrader 5 (MT5), June to November 2026, shows three real examples side by side on both timeframes, including one where the timeframes disagreed, and ends with a simple top-down routine you can use every day.
What you will learn
- Why the same take looks different on each timeframe
- Which timeframe each liquidity level belongs to
- The study: the 15-minute reaction against the daily close, in 429 takes
- Do bigger levels produce more reversals?
- Real chart: a 15-minute breakout that was a daily wick, 1 July 2026
- Real chart: both timeframes agree, 19 August 2026
- When the timeframes disagree: a 15-minute sweep the daily chart ignored, 21 August 2026
- A top-down routine for liquidity, common mistakes, FAQ and quiz
1. Why the same take looks different on each timeframe
A candle on any chart is a summary. A daily candle summarises 24 hours of trading into four numbers: open, high, low and close. A 15-minute candle summarises a quarter of an hour. When price trades through a level, every timeframe sees the same trades, but each one summarises them differently.
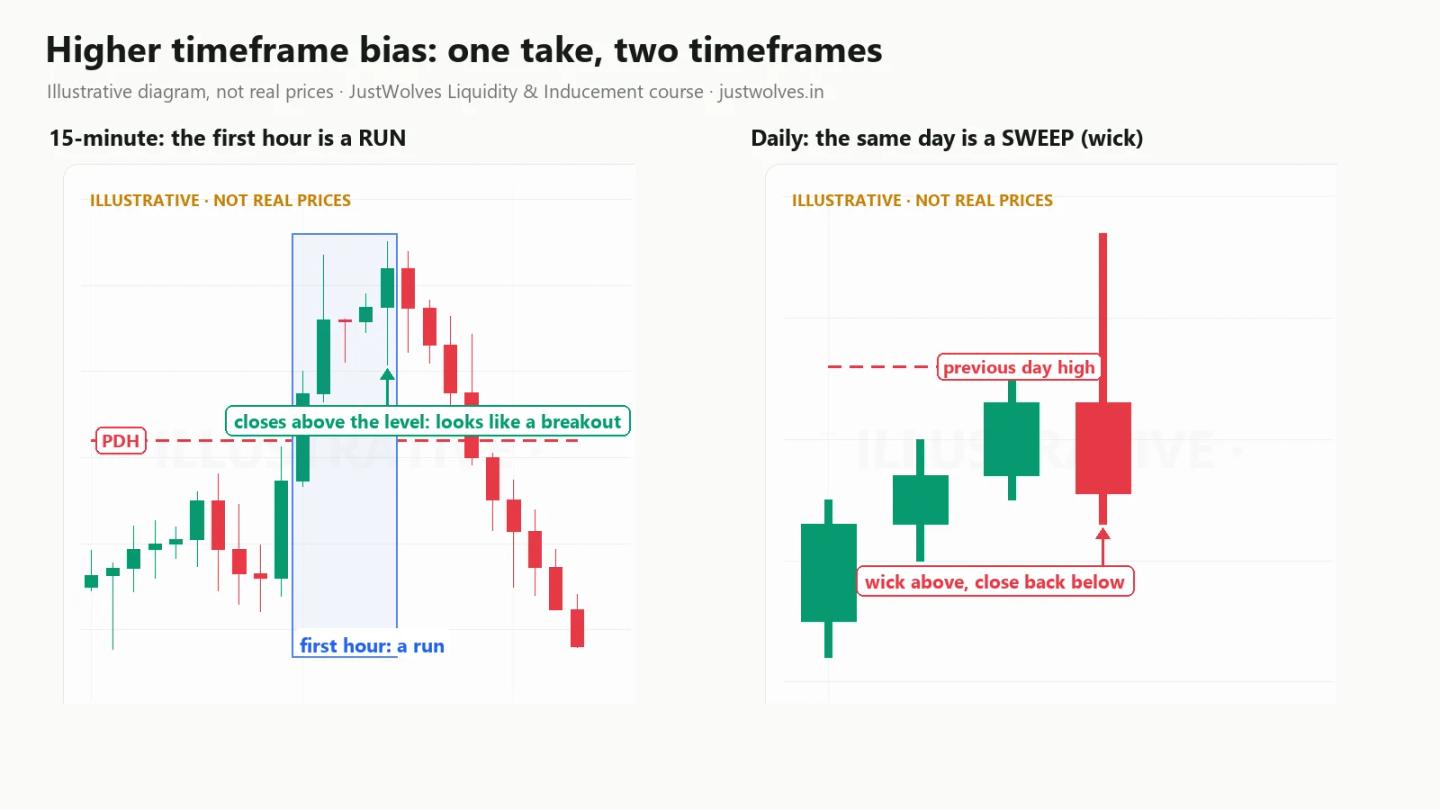
Take a previous day high. On the 15-minute chart, price might break above it, close above it four candles in a row and look like a clean breakout, which Lesson 6 called a run. But if price falls back below the level later in the day and the day closes underneath, the daily chart shows something very different: a candle with a wick above the previous day high and a close back inside. On the daily chart, that is a sweep.
Both readings are correct. They just answer different questions:
- The 15-minute chart tells you what happened in the first hour after the level was taken. That matters if you are trading the next few hours.
- The daily chart tells you where the whole day settled relative to the level. That matters if you hold for days, and it is what most swing traders, and most of the large players in the market, will look at tomorrow morning.
This is the core idea of multiple timeframe analysis for liquidity: a take is not a sweep or a breakout in general; it is a sweep or a breakout on a particular timeframe. Before you call it either, decide which timeframe you are reading.
2. Which timeframe each liquidity level belongs to
Each level on your liquidity map from Lesson 1 comes from a particular timeframe, and it helps to know which:
| Level | Comes from | Who watches it most |
|---|---|---|
| Previous week high and low (PWH, PWL) | The weekly candle | Swing and position traders |
| Previous day high and low (PDH, PDL) | The daily candle | Day traders and swing traders |
| Asian and London session highs and lows | A few hours of the day (Lesson 5) | Intraday traders |
| 1-hour swing highs and lows, old highs and lows (Lesson 8) | The 1-hour chart | Intraday and short swing traders |
| 15-minute swings, first pullbacks (Lesson 7) | The 15-minute chart | Scalpers and short-term traders |
A common idea in trading education is that higher-timeframe levels are "stronger" and produce bigger reactions. We test that in section 4. The result is smaller than most courses suggest.
The practical point of the table is the top-down order. You start with the levels from the largest candles, because they frame the whole week, and then work down: the daily range, then the 1-hour dealing range from Lesson 3, and only then the 15-minute chart for the reaction.
3. The study: the 15-minute reaction against the daily close
To see how often the two timeframes agree, we took the 429 first takes from Lesson 6: every first time gold traded through a previous day high or low, a previous week high or low, or an Asian or London session high or low (by more than 50 cents) between 1 June and 17 November 2026.
For each take we already had the 15-minute reaction from Lesson 6: sweep, run, trap or mixed. Now we added one more fact: where did that trading day close, at 17:00 New York time? Beyond the level, or back inside it?
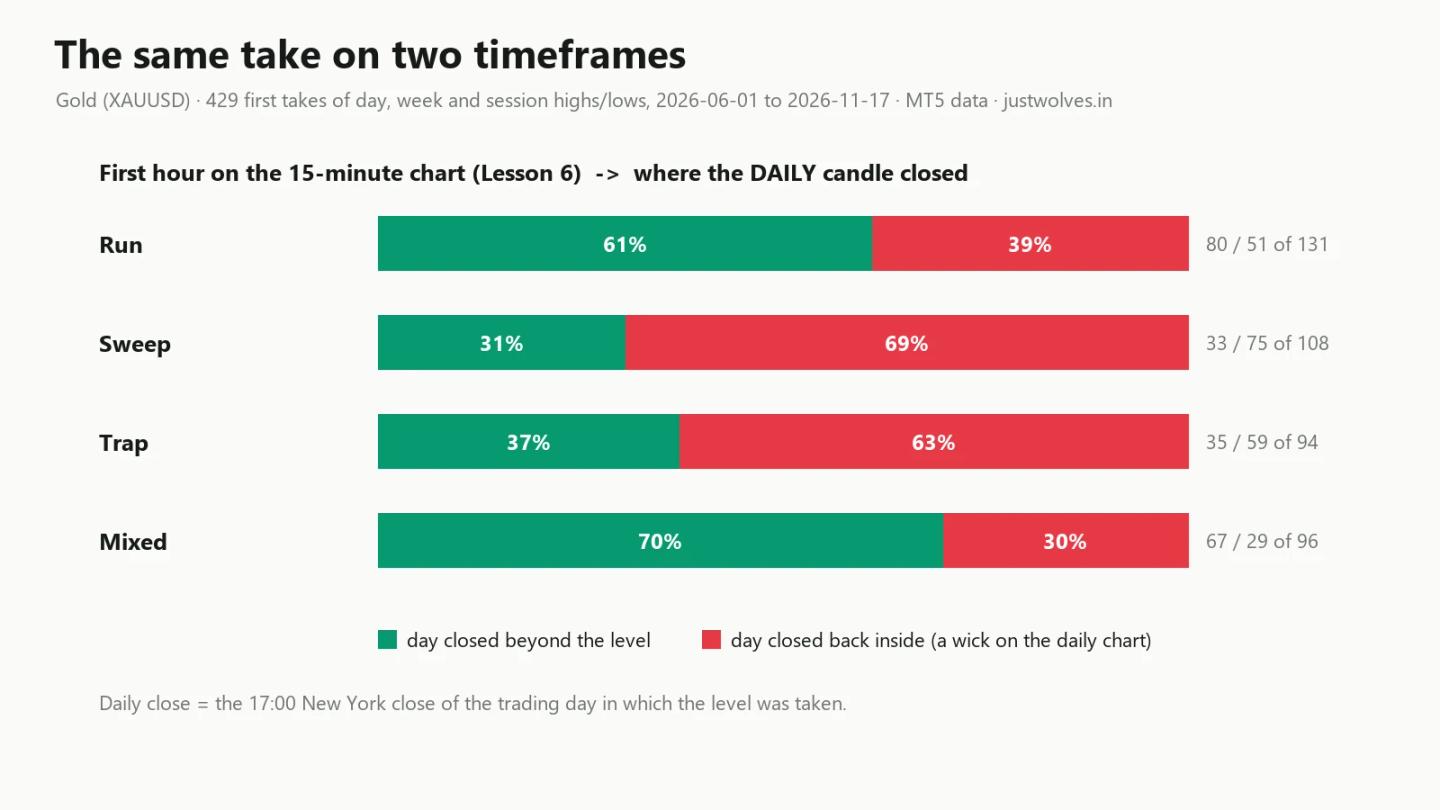
| 15-minute reaction in the first hour | Takes | Day closed beyond the level | Day closed back inside |
|---|---|---|---|
| Run (closed beyond and stayed beyond) | 131 | 80 (61%) | 51 (39%) |
| Sweep (closed back inside at once) | 108 | 33 (31%) | 75 (69%) |
| Trap (closed beyond, then back inside) | 94 | 35 (37%) | 59 (63%) |
| Mixed | 96 | 67 (70%) | 29 (30%) |
| All | 429 | 215 (50%) | 214 (50%) |
Gold (XAUUSD), first takes of PDH/PDL, PWH/PWL and Asian and London session highs and lows, MT5 data. These are counts from the past, not a prediction.
Reading the table:
- The 15-minute reaction did point the right way more often than not. After a run, the day closed beyond the level 61% of the time. After a sweep, the day closed back inside 69% of the time. The first hour carried real information about the rest of the day.
- But it was wrong often. About two runs in five (39%) ended as a wick on the daily chart. And almost one sweep in three (31%) ended with the day closing beyond the level anyway. If you trade a 15-minute run as if it settles the daily picture, you will be wrong in a large minority of cases.
- Across all 429 takes, the split was exactly even: 215 days closed beyond, 214 back inside. Taking a level, by itself, told you nothing about where the day would close. It was the reaction that tilted the odds, and only partly.
We also checked the 1-hour chart. When the 1-hour candle containing the take closed beyond the level, the day also closed beyond it in 128 of 223 cases (57%). When the 1-hour candle closed back inside, the day also closed inside in 119 of 206 (58%). The 1-hour close alone was only a little better than a coin toss at predicting the daily close. The 15-minute reaction over a full hour, which looks at five closes instead of one, did better.
4. Do bigger levels produce more reversals?
Many traders believe that a sweep of a weekly level is stronger than a sweep of a session level. We grouped the same 429 takes by the timeframe of the level and looked at the four-hour outcome from Lesson 6: did price move two ATR back inside (reversal) or two ATR further beyond (continuation) first?
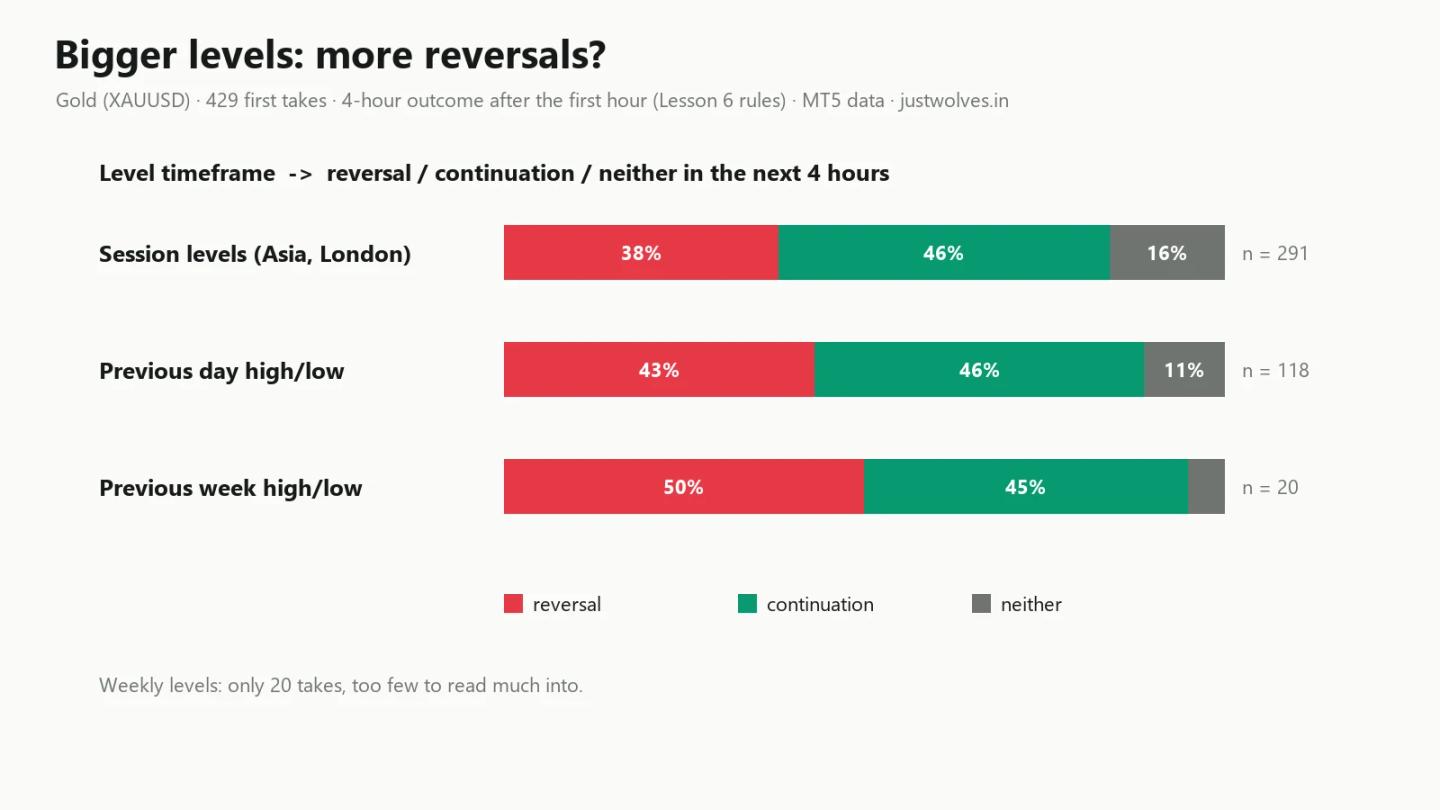
| Level timeframe | Takes | Reversal | Continuation | Neither |
|---|---|---|---|---|
| Session high or low (Asia, London) | 291 | 111 (38%) | 134 (46%) | 46 (16%) |
| Previous day high or low | 118 | 51 (43%) | 54 (46%) | 13 (11%) |
| Previous week high or low | 20 | 10 (50%) | 9 (45%) | 1 (5%) |
Gold (XAUUSD), MT5 data. Weekly levels: only 20 takes, too few to draw conclusions from.
There is a small tilt: the share of reversals rose from 38% for session levels to 43% for daily levels and 50% for weekly levels. But continuation stayed at about 46% in every group, the weekly group is tiny, and the difference between session and daily levels is a few percentage points. In this sample, bigger levels were not dramatically more likely to reverse.
So why bother with higher-timeframe levels? Because they set the frame, not because they guarantee a reaction. A previous week high tells you where the edges of the bigger range are. Whether price reverses there or runs through still depends on the reaction, which is exactly what you read on the lower timeframe.
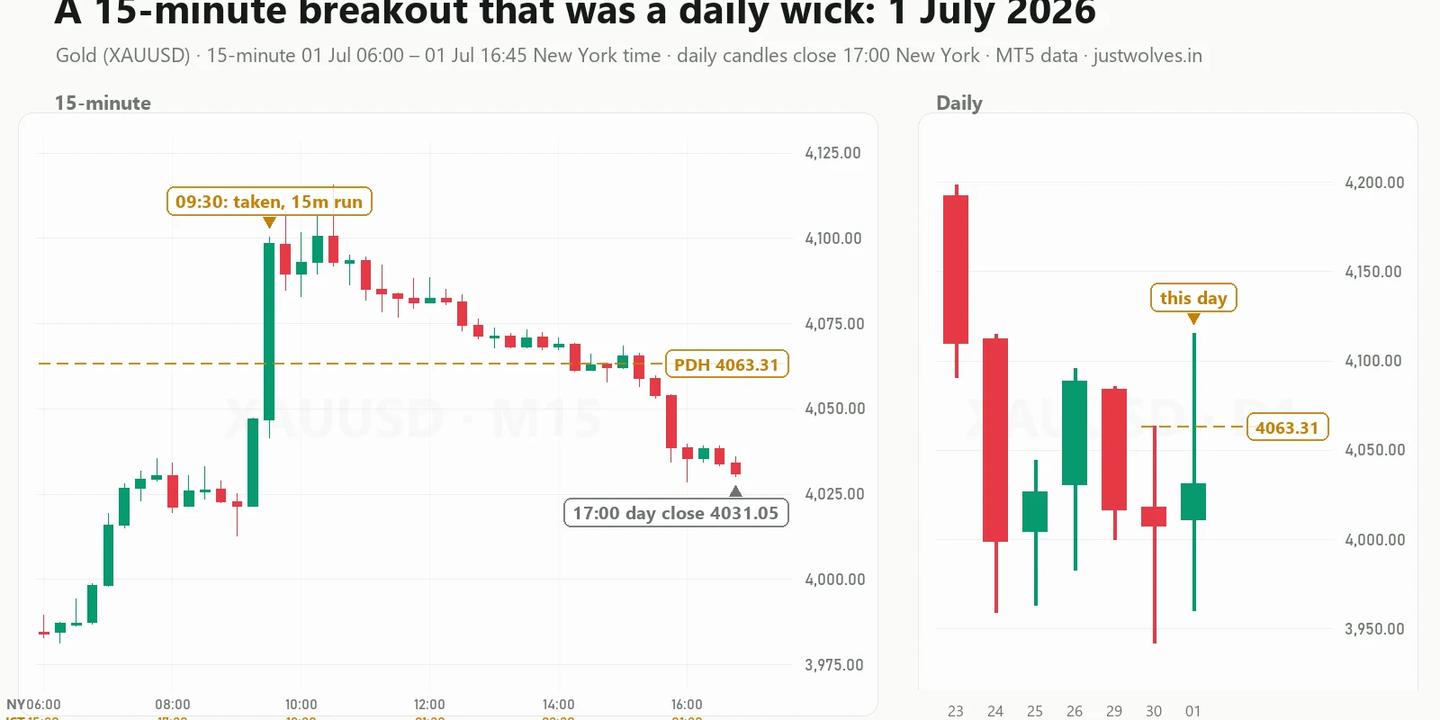
5. Real chart: a 15-minute breakout that was a daily wick, Wednesday 1 July 2026
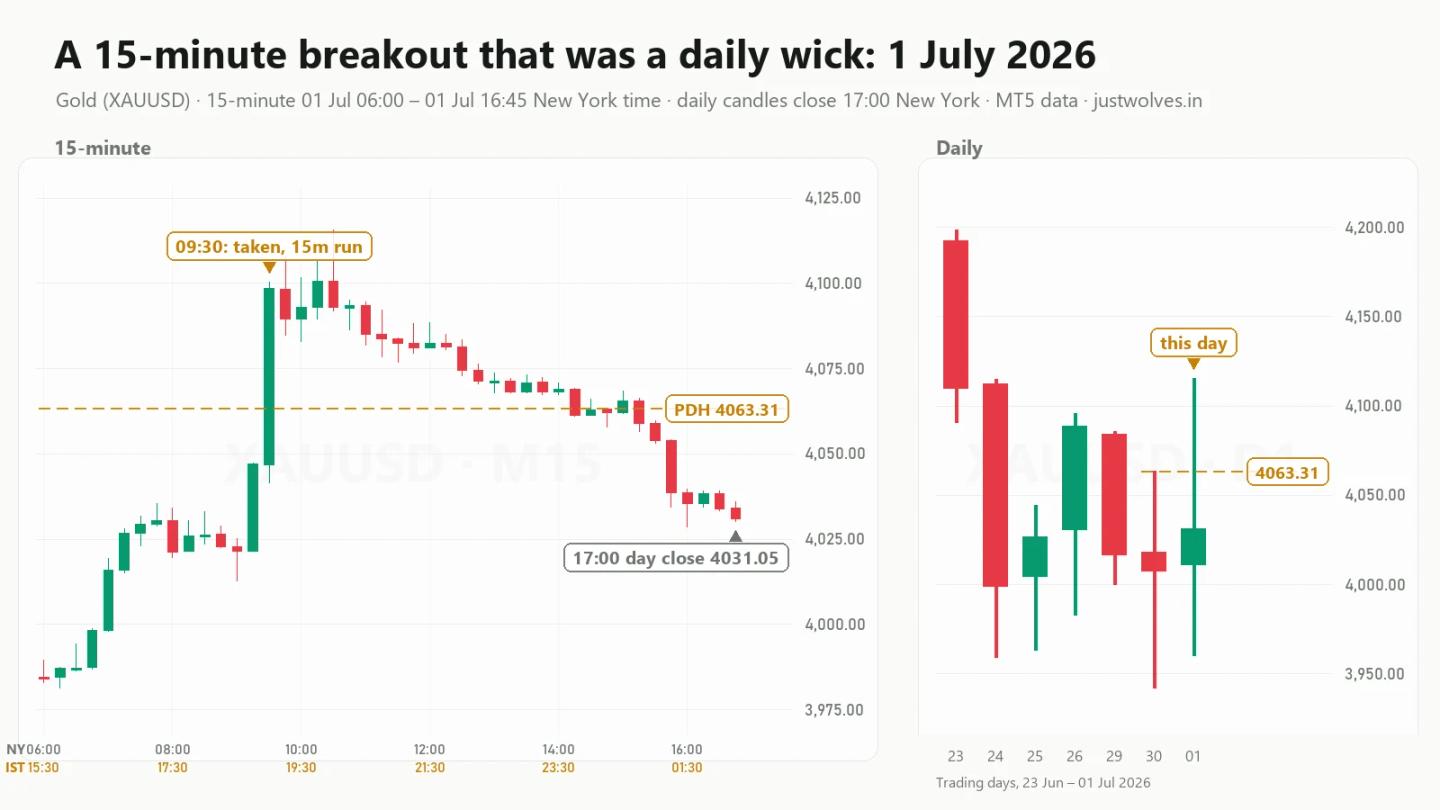
- The level. The previous day high was 4063.31, the high of the trading day of 30 June.
- The take, on the 15-minute chart. At 09:30 New York time (19:00 India time) on 1 July, one candle traded from a low of 4041.59 to a high of 4100.36 and closed at 4098.38, about $35 above the level. The next four candles closed at 4089.45, 4092.92, 4100.60 and 4092.93, all above. By the rules of Lesson 6 this was a clear run, and by 10:30 gold had reached 4115.56, which also counts as a continuation in the four-hour test.
- What the rest of the day did. From there, price drifted lower all afternoon. At 14:15 a 15-minute candle closed back below 4063.31 for the first time, and the trading day closed at 17:00 at 4031.05, $32 below the level.
- On the daily chart. The 1 July candle shows a long upper wick through the previous day high and a close back inside. A trader looking only at the daily chart the next morning would call this a sweep of the previous day high.
Who was right? Both. A 15-minute trader who bought the run and took profit in the first hour was right. A swing trader who read the day as a sweep was also right. The trader who got hurt was the one who bought the 15-minute run and expected it to hold for days. That trader was using a 15-minute signal to make a daily decision.
Interactive chart: gold 15-minute, 1 July 2026 (MT5 data)
Loading historical candles…
6. Real chart: both timeframes agree, Wednesday 19 August 2026
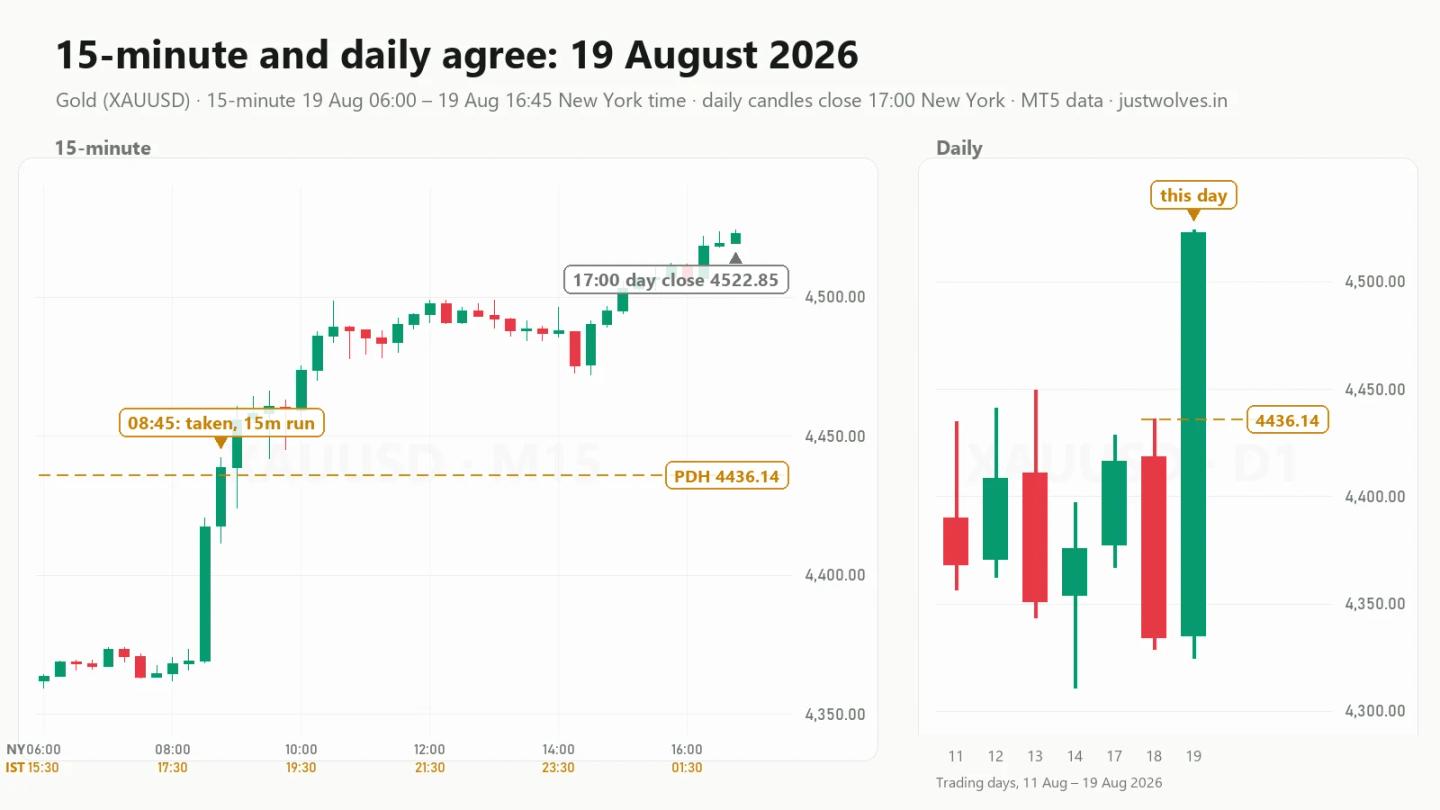
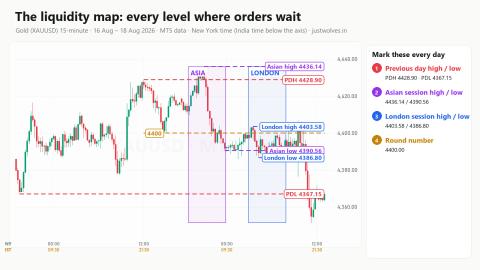
- The level. The previous day high was 4436.14, the high of 18 August. (You met 18 August in Lesson 1, where the same morning was used for the full liquidity map.)
- The take. At 08:45 New York time a candle traded to 4442.29 and closed at 4438.72. The next four candles closed at 4456.10, 4458.16, 4460.72 and 4459.78: a run.
- The rest of the day. Price kept climbing and made the day's high of 4524.17 in the last 15-minute candle, at 16:45. The day closed at 4522.85.
- On the daily chart. A large bullish candle closed far above the previous day high: a breakout, not a sweep.
Here the 15-minute run and the daily close told the same story. That is what you want before treating a breakout as more than an intraday move. In our sample, 80 of 131 runs (61%) ended this way.
7. When the timeframes disagree: a 15-minute sweep the daily chart ignored, 20–21 August 2026
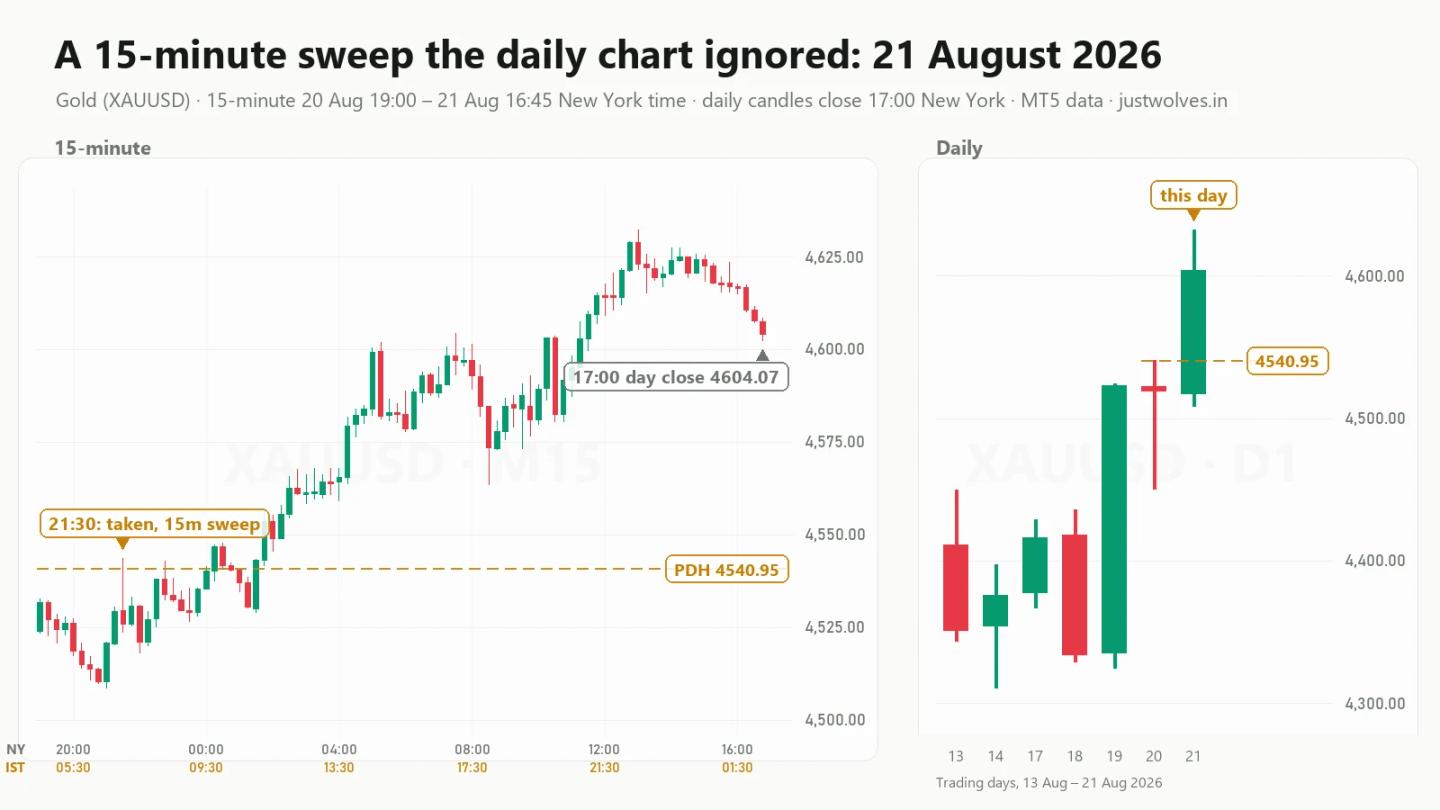
This is the failure case, and it follows straight on from section 6.
- The level. The previous day high was 4540.95, the high of the trading day of 20 August.
- The take. Early in the next trading day, at 21:30 New York time on 20 August (07:00 India time on 21 August), a candle traded to 4543.59 and closed at 4525.98, back below the level. The next four candles closed at 4530.67, 4520.97, 4527.25 and 4538.08, all below. By the rules of Lesson 6, this was a sweep, and the 1-hour candle also closed back inside at 4530.67.
- What happened next. Price dipped only to 4518.15 at 22:00. At 00:15 a 15-minute candle closed back above the level at 4546.79, and gold climbed for most of the day, reaching 4632.22 at 13:00. The trading day closed at 4604.07.
- On the daily chart. A strong bullish candle closing $63 above the previous day high. Nothing on the daily chart looks like a sweep at all.
What could have warned you? Look at the daily panel. The day before had a long lower wick and closed near its open, and the day before that was a very large bullish candle (19 August, from section 6). The daily trend was strongly up, and the previous day high was a level in the direction of that trend. A 15-minute sweep against a strong daily move is one of the 33 sweeps (31%) where the day closed beyond anyway. The lower timeframe said "reversal"; the higher timeframe never agreed.
Interactive chart: gold daily, 10–21 August 2026 (MT5 data)
Loading historical candles…
8. Top down analysis in trading: a routine for liquidity
Here is a simple routine that puts this lesson together. It takes about ten minutes before a session.
- Weekly and daily: the frame. Mark the previous week high and low and the previous day high and low. Note the direction of the last few daily candles. Which side is the market moving towards? That side's levels are the likelier targets (Lesson 8 showed levels in the direction of the move were taken more often).
- 1-hour: the dealing range. Mark the current 1-hour dealing range, its external liquidity (the range high and low) and its internal liquidity (Lesson 3). Add old 1-hour highs and lows within about one daily ATR.
- Session: the timing. Note which session you are in and where the Asian range sits (Lesson 5).
- 15-minute: the reaction. Only when price takes a level do you drop to the 15-minute chart and classify the first hour: sweep, run, trap or mixed (Lesson 6).
- Ask whether the timeframes agree. A 15-minute sweep of a level against the daily direction is the weakest case (section 7). A 15-minute sweep in line with the daily direction, or a run that the daily trend supports, is a stronger one.
- Match your holding time to the timeframe you read. If your signal is a 15-minute reaction, plan to manage the trade over hours, not days. If you want to hold for days, wait for the daily candle to confirm.
For a general introduction to reading several charts at once, see our multi-timeframe analysis lesson, and for the smart money version, multi-timeframe SMC analysis. Lesson 12 builds the daily direction into a written daily bias, and our daily and weekly bias lesson covers the ICT approach to it.
Common mistakes in multiple timeframe analysis
- Calling a take a sweep or breakout without naming the timeframe. On 1 July, the same take was a run on the 15-minute chart and a sweep on the daily chart.
- Using a 15-minute signal to make a multi-day decision. About two in five 15-minute runs ended as daily wicks.
- Fading a strong daily trend because of one 15-minute sweep. On 21 August the sweep lasted less than three hours, and the day closed $63 beyond the level.
- Assuming higher-timeframe levels always reverse. Weekly and daily levels reversed only slightly more often than session levels in our sample.
- Looking at too many timeframes. Three is enough: one for the frame (daily), one for structure (1-hour) and one for the reaction (15-minute).
Homework
For the next five liquidity takes you see on gold (any of the levels in section 2), write down two things: the 15-minute reaction in the first hour (sweep, run, trap or mixed) and, after 17:00 New York time, whether the daily candle closed beyond the level or back inside. After five takes, compare your results with the table in section 3.
Practise on the live gold chart
● LiveFrequently Asked Questions
What is multiple timeframe analysis?
Reading the same market on more than one chart: usually a higher timeframe (daily or weekly) for direction and the main levels, and a lower timeframe (1-hour or 15-minute) for timing and the reaction.
Can a sweep on one timeframe be a breakout on another?
Yes. On 1 July 2026, gold's take of the previous day high was a clean run on the 15-minute chart but a wick and close back inside on the daily chart. In our 429 takes, 39% of 15-minute runs ended as daily wicks.
Which timeframe should I use to read the reaction?
The one that matches how long you plan to hold. A 15-minute reaction is useful for a trade over the next few hours. For a trade over several days, wait for the daily close.
Are higher-timeframe liquidity levels stronger?
Only slightly, in our sample. Reversals were 38% for session levels, 43% for previous day levels and 50% for previous week levels (only 20 cases). Continuation was about 46% in every group.
What is the best timeframe combination for gold?
There is no single best one. This course uses daily for the frame, 1-hour for the dealing range and 15-minute for the reaction, because those three answered different questions clearly in our tests.
Test Your Knowledge
What does multiple timeframe analysis mean?
Related lessons
Education only. Not investment advice or a recommendation to trade. JustWolves is not a SEBI-registered adviser. Charts and statistics use historical MT5 chart data for gold from June to November 2026; they describe past behaviour in one market and period and are not a forecast or a record of real trades. Trading forex and commodities involves substantial risk of loss.