
What Is Liquidity in SMC? Buy-Side and Sell-Side Liquidity
JustWolves is an educational platform and is not a SEBI-registered investment advisor. Trading financial instruments involves significant risk of loss and may not be suitable for all investors. Past performance is not indicative of future results. Read our full disclaimer →
What you'll learn
- In SMC, 'liquidity' usually means clusters of resting orders, especially stop orders, beyond obvious highs and lows
- Buy-side liquidity (BSL) sits above swing highs; sell-side liquidity (SSL) sits below swing lows
- The more obvious and more tested a level, the more orders are likely to rest beyond it
- External liquidity is at major swings; internal liquidity is at minor swings inside the range
- Mark liquidity to anticipate where price may travel, and keep your own stops away from the obvious spots
In this article · 17 sections
In everyday trading, liquidity means how easily you can buy or sell without moving the price. In Smart Money Concepts, the word has a narrower meaning: the pools of resting orders, mostly stop-losses and breakout entries, that build up beyond obvious highs and lows. SMC treats these pools as places price often travels to. This lesson explains where they form, why, and how to mark them on your chart.
What You Will Learn
- The two meanings of liquidity and which one SMC uses
- What buy-side and sell-side liquidity are and where they form
- The difference between external and internal liquidity
- A routine for marking liquidity before each session
Before You Start
Read Break of Structure vs Change of Character and make sure you know how stop and limit orders work from Forex Order Types.
Two Meanings of Liquidity
Market liquidity is how much you can trade without moving price much. Major currency pairs during the London–New York overlap are highly liquid; exotic pairs at the weekly open are not. You can see it in tight spreads and smooth, continuous candles.
Liquidity in SMC refers to specific price levels where orders are likely to be resting. Because many traders place stops and breakout orders at similar, obvious places, those places hold more orders than the levels around them. When price reaches them, the orders are triggered and become market orders.
Buy-Side Liquidity (BSL)
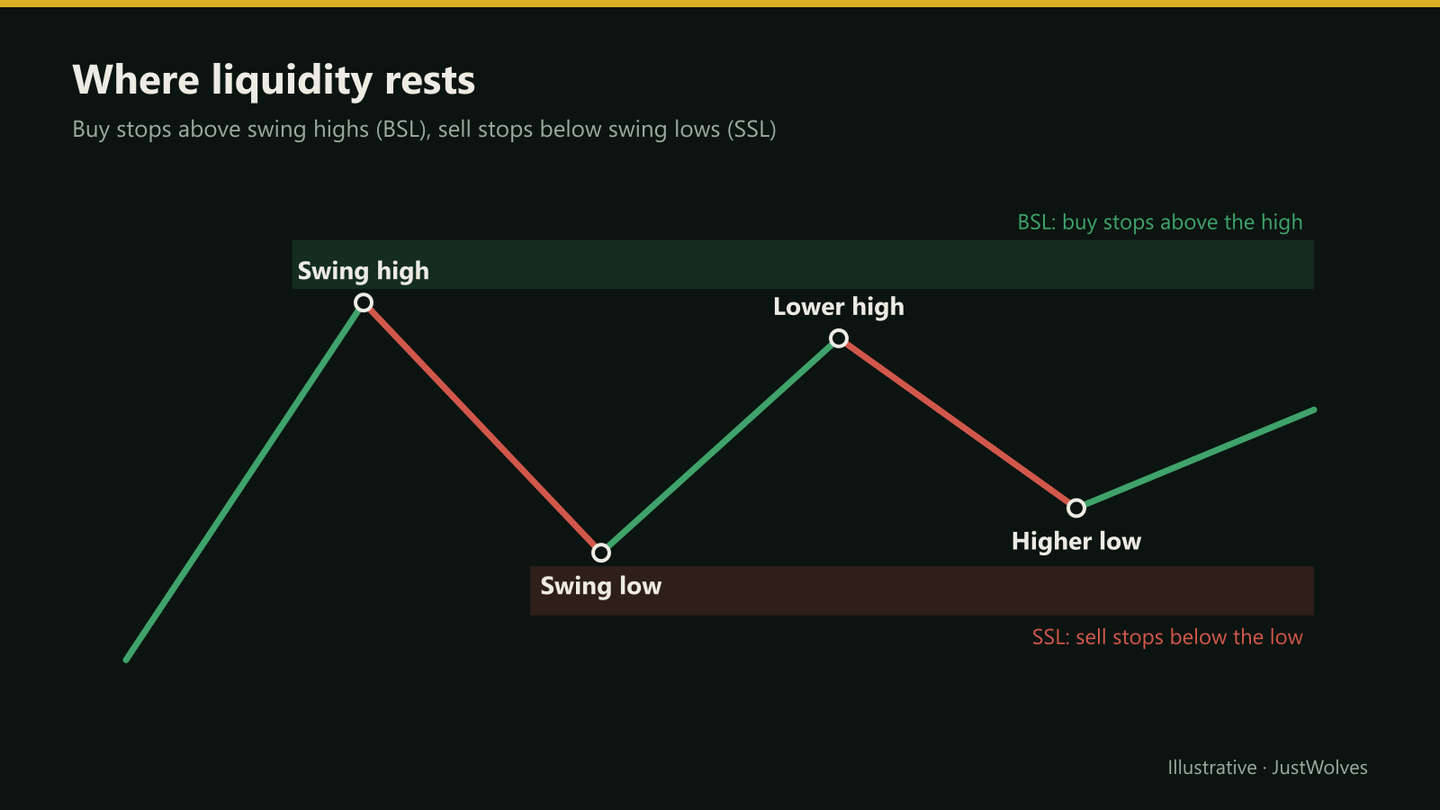
Buy-side liquidity is the pool of buy orders resting above swing highs. It comes from two groups: short sellers whose stop-losses sit above the high (a stop on a short is a buy order), and breakout traders with buy-stop orders to enter if price breaks higher.
If price trades through the high, those buy orders are triggered. That can fuel a breakout, or, if there isn't enough follow-through, it can mark the point where price reverses. Both outcomes are covered in lesson 02.02.03.
Sell-Side Liquidity (SSL)
Sell-side liquidity is the mirror image: sell orders resting below swing lows, from long traders' stop-losses and breakdown traders' sell-stop entries. When price trades below the low, those orders become sells.
Why These Levels Attract Price
SMC's explanation is that large participants need many orders on the other side to fill big positions without moving the market against themselves, and clusters of stops offer exactly that. A large seller, for example, would find many buy orders just above an obvious high.
That explanation is plausible but can't be verified from a retail chart. What you *can* observe is that obvious highs and lows are frequently traded through, and that price often reacts sharply once they are. Use that observation; treat the institutional story as interpretation.
How Often Are Prior-Day Highs and Lows Taken?
The previous day's high and low are the most widely watched liquidity levels in forex. JustWolves measured how often the next trading day actually reached them. We used about two years of daily candles (November 2024 to November 2026) for EUR/USD, GBP/USD, USD/JPY and gold, with forex days ending at 5 pm New York time.
| Market | Traded above prior high | Traded below prior low | Both sides | Neither (inside day) |
|---|---|---|---|---|
| EUR/USD | 45% | 48% | 9% | 16% |
| GBP/USD | 48% | 48% | 12% | 16% |
| USD/JPY | 52% | 40% | 9% | 17% |
| Gold | 54% | 45% | 11% | 12% |
| All four | 50% | 45% | 10% | 15% |
Two practical points come out of this. First, about 85% of days reach at least one side of the previous day's range. That is why these levels make sensible targets: price regularly travels to them. Second, only about one day in ten reaches both sides. So once one side has been taken early in the day, assuming the other side "must" be next is usually wrong. A liquidity map tells you where price is likely to look, not that it will get there.
Practise marking liquidity: GBP/USD
Loading historical candles…
External vs Internal Liquidity
- External liquidity: beyond the major swing highs and lows of the range, such as the previous day's or week's high and low, or the extremes of a trend leg. These are larger, more widely watched pools.
- Internal liquidity: beyond the minor swings inside the range, and around imbalances such as fair value gaps (module 02.03). These are smaller targets price may reach on the way to external liquidity.
A common SMC idea is that price alternates between the two: after taking external liquidity on one side, it often draws back into internal liquidity, and vice versa. Use it as a planning framework, not a rule.
See a Liquidity Map Play Out
The chart below walks through the external–internal–external sequence on an illustrative range. Step through it slowly. At each step, ask yourself where the nearest pool of orders sits before you reveal the next candle. Use the Liquidity toggle to hide the lines and check whether you can find the levels on your own.
Reading a liquidity map: external, internal, external
Step 1 of 6
Map the obvious levels
Two highs near 1.2748 and a low at 1.2664 define a range. Buy stops from shorts, and buy-stop entries from breakout traders, sit above the highs (buy-side liquidity). Sell stops from longs sit below the low (sell-side liquidity).
- What to observe
- Highs and lows that almost everyone watching this chart can see.
- Condition
- Mark BSL and SSL before you form a directional view.
Step by Step: Marking Liquidity
Before each session
Step 1: Higher timeframe extremes
On the 4-hour or daily chart, mark the previous day's and week's high and low.
Step 2: Major swings
Mark the most obvious recent swing highs (BSL) and lows (SSL).
Step 3: Equal highs and lows
Mark any flat double tops or bottoms; these are dense pools (lesson 02.02.02).
Step 4: Session extremes
Mark the Asian session high and low before London opens.
Step 5: Rank them
Note which are external (major) and which internal (minor).
Practical Example
Before the London open, Rohit marks GBP/USD's previous day high at 1.2745, an equal-high pair at 1.2720 on the 1-hour chart, and the Asian session low at 1.2668. He notes BSL above 1.2720 and 1.2745, and SSL below 1.2668.
His stop on an existing long is at 1.2665, just three pips below the Asian low, inside the most obvious sell-side pool. He moves it to 1.2652, beyond the cluster and below the next structural level, and reduces his size to keep the risk at 1%.
Using a Liquidity Map in a Trading Plan
A liquidity map is most useful when it changes concrete decisions. Three uses matter most:
- Targets. If you are long, the nearest buy-side pool above you is a natural place to take some or all of the profit. Price often accelerates into it and then pauses or reverses once those orders are filled.
- Stops. Your stop should not sit inside the most obvious pool on your side of the trade. Place it beyond the level where your idea is genuinely wrong, and size the position so the wider stop still risks the same amount. See Position Sizing.
- Entries. A pool that has just been taken and rejected, a sweep, can mark the start of a move toward the opposite pool. That is the basis of the sweep and CRT setups in later lessons.
Keep the map short. Five or six levels, the previous day's and week's highs and lows plus the most obvious recent swings, is enough. A chart covered with twenty lines is a chart where every move "hits liquidity", which tells you nothing.
The Psychology of Liquidity
Liquidity concepts change how losing trades feel. A stop hit by a quick spike through an obvious level can feel deliberate, as if the market targeted you. The data says something more ordinary: obvious levels are reached often, and stops placed exactly at them are filled often. Seeing it that way turns frustration into a fixable process problem: move the stop beyond the cluster, or reduce size until the wider stop is affordable.
Common Mistakes
- Confusing the two meanings of liquidity.
- Assuming every high or low will be taken. Many aren't.
- Placing stops exactly beyond obvious levels, where they are most likely to be hit.
- Entering every breakout of an obvious level without waiting to see if it holds.
- Treating institutional explanations as facts.
Professional Insight
Experienced traders use liquidity maps mainly for two things: choosing realistic targets (where is price likely to travel next?) and placing stops sensibly (where are stops least likely to be clustered?). Neither requires believing any particular story about who is on the other side.
Risk Considerations
- Liquidity levels can break cleanly and keep going.
- Stops beyond obvious levels need wider distances; reduce size accordingly.
- Thin markets produce misleading spikes through levels.
Important Terminology
| Term | Meaning |
|---|---|
| Liquidity (SMC) | Clusters of resting orders at specific levels. |
| Buy-side liquidity (BSL) | Buy orders resting above swing highs. |
| Sell-side liquidity (SSL) | Sell orders resting below swing lows. |
| External liquidity | Liquidity beyond major swing extremes. |
| Internal liquidity | Liquidity at minor swings or imbalances inside a range. |
| Stop order | An order that becomes a market order at a trigger price. |
What is liquidity in Smart Money Concepts?
Clusters of resting orders, mostly stop-losses and breakout entries, beyond obvious highs and lows.
What is buy-side liquidity?
Buy orders resting above swing highs, from short sellers' stops and breakout buy-stops.
What is sell-side liquidity?
Sell orders resting below swing lows, from long traders' stops and breakdown sell-stops.
Do banks hunt stop-losses?
SMC suggests large participants use stop clusters to fill orders. It's a plausible interpretation, but retail traders can't verify who is trading.
Where should I place my stop?
Beyond the level that invalidates your idea and away from the most obvious cluster, with size reduced to keep risk constant.
How often does price take the previous day's high or low?
In our study of about 2,065 trading days across EUR/USD, GBP/USD, USD/JPY and gold, the next day traded above the prior high 50% of the time and below the prior low 45% of the time. About 85% of days reached at least one side; only about 10% reached both.
What is the difference between external and internal liquidity?
External liquidity rests beyond the major highs and lows of a range or trend leg, such as the previous day's high. Internal liquidity sits inside the range, around minor swings and fair value gaps. Price often alternates between the two.
Practical Exercise
Build a liquidity map.
Your task
Step 1: Choose a pair
EUR/USD or GBP/USD.
Step 2: Mark six levels
Previous day high/low, previous week high/low, Asian high/low.
Step 3: Label each
BSL or SSL, external or internal.
Step 4: Review after the session
Which were traded through, and what did price do next?
Check Your Understanding
Where does buy-side liquidity rest?
Related Lessons
Previous module: Market Structure Shift vs CHoCH. Next: Equal Highs and Equal Lows. See also Forex Order Types.