Swing High and Swing Low Liquidity: Old Highs, Old Lows and Stacked Traps
JustWolves is an educational platform and is not a SEBI-registered investment advisor. Trading financial instruments involves significant risk of loss and may not be suitable for all investors. Past performance is not indicative of future results. Read our full disclaimer →
What you'll learn
- Old highs and lows are swing levels left untouched; the stops behind them are still there. Traders call this liquidity on the left.
- Of 227 old 1-hour levels on gold, 64% were taken within the next five trading days.
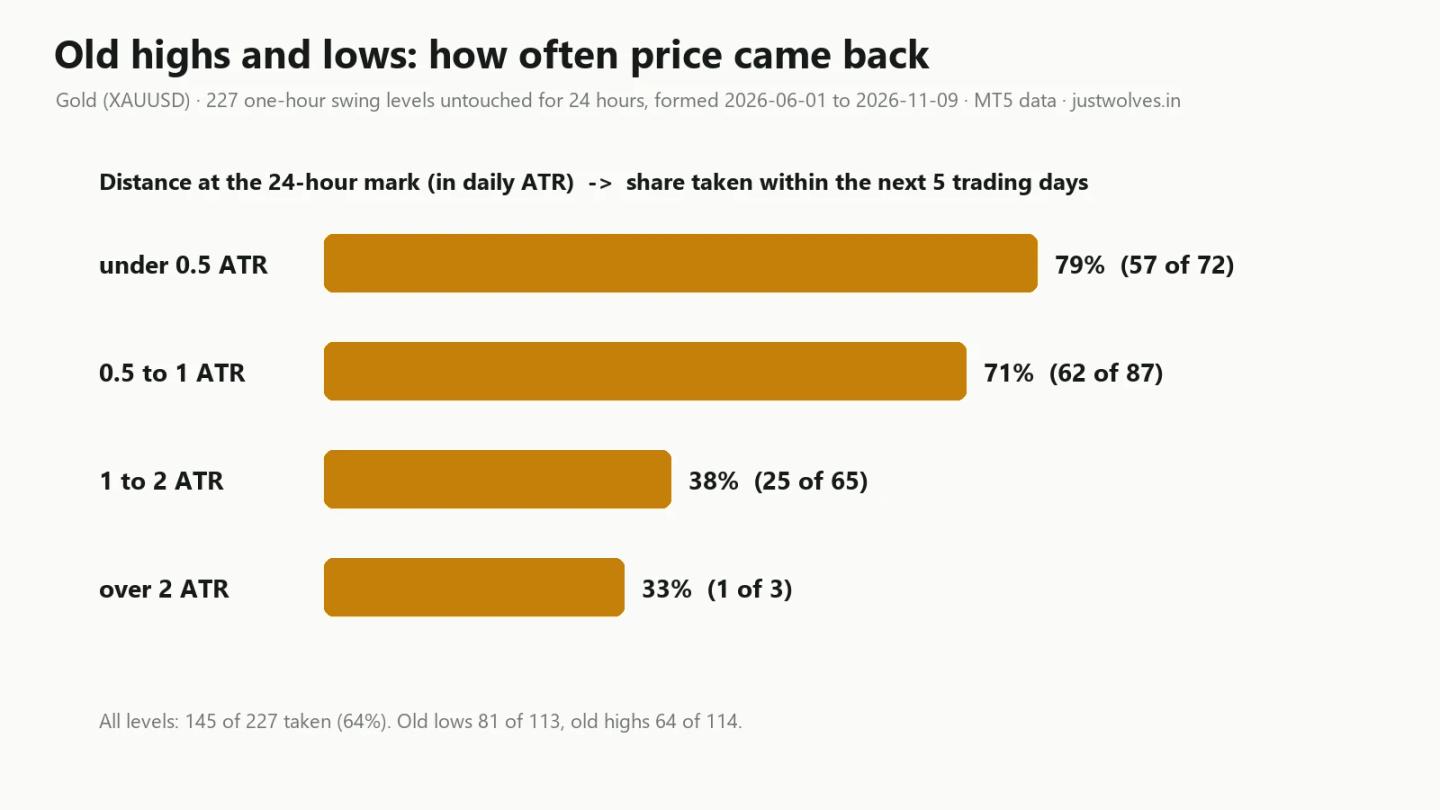
- Distance mattered most: 79% of levels under 0.5 daily ATR away were taken, but only 38% of those 1 to 2 ATR away.
- Levels in the direction of the trend were taken more often (old lows 72%, old highs 56% in a mostly falling period).
- Inducement often comes in layers: in 79 of 156 bait cases, a second pullback level was taken too. A second bait was not a sign the move was about to go.
In this article · 12 sections
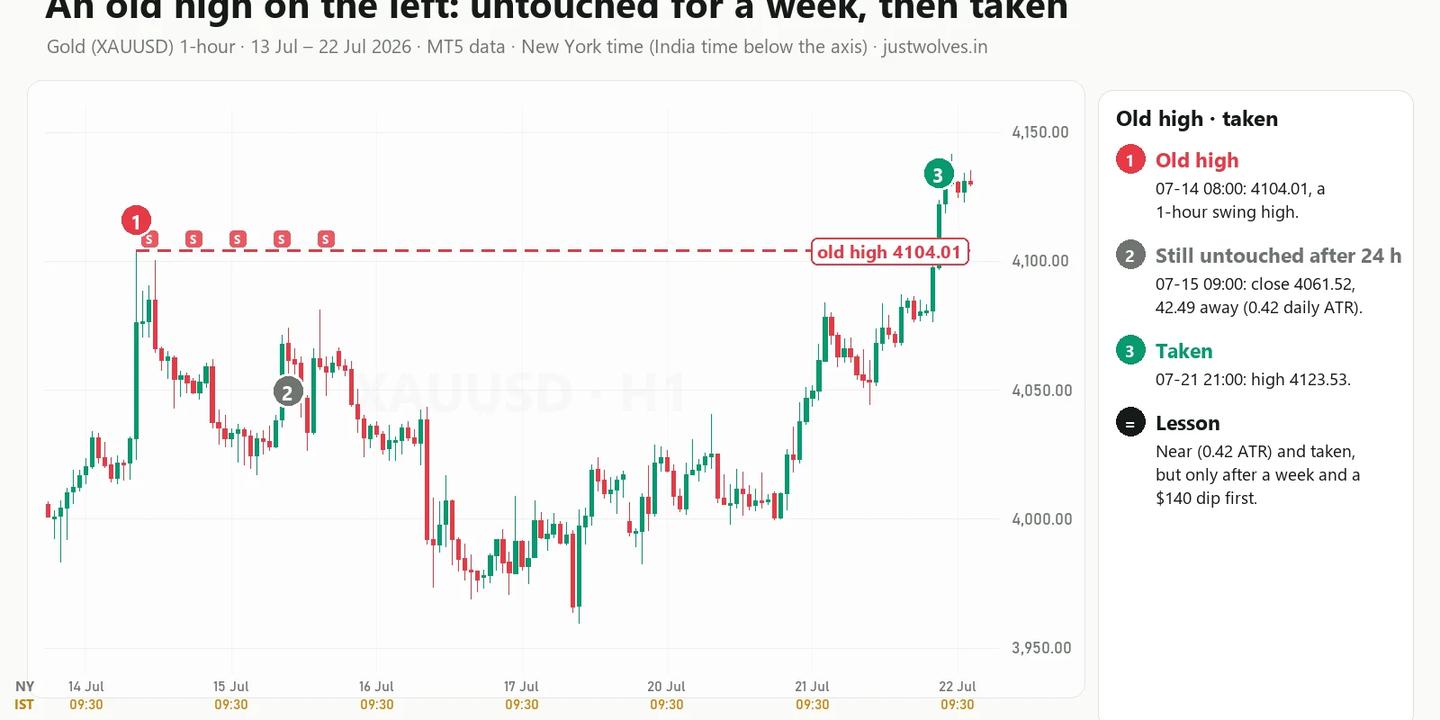
Swing high and swing low liquidity is the pool of stops resting behind old highs and lows: swing points that price left behind and has not traded through since. Traders call them "liquidity on the left", because when you look at a chart they sit to the left of current price, still holding the stop orders placed behind them. This lesson shows how often 227 real old highs and lows on gold were taken within five trading days, how much the distance to the level mattered, and what happens when inducement comes in layers: one pullback taken, then a second, and only then the real move. All charts use gold (XAUUSD) data from MetaTrader 5 (MT5), June to November 2026.
What you will learn
- What "liquidity on the left" means
- How we defined an old high or low
- How often old highs and lows were taken, by distance
- Real chart: an old high taken a week later, 14–21 July 2026
- Real chart: a nearby old high that was never taken, 9–16 July 2026
- Stacked traps: when inducement comes in layers
- Real chart: two pullback lows taken, then the move, 13–14 July 2026
- How to use old levels and stacked traps, common mistakes, FAQ and quiz
1. What "liquidity on the left" means
In Lesson 1 you learned that liquidity is the orders waiting at a price, and that it collects above highs (buy-side) and below lows (sell-side). Most of the examples so far were recent: yesterday's high, this session's low, the first pullback of the current move.
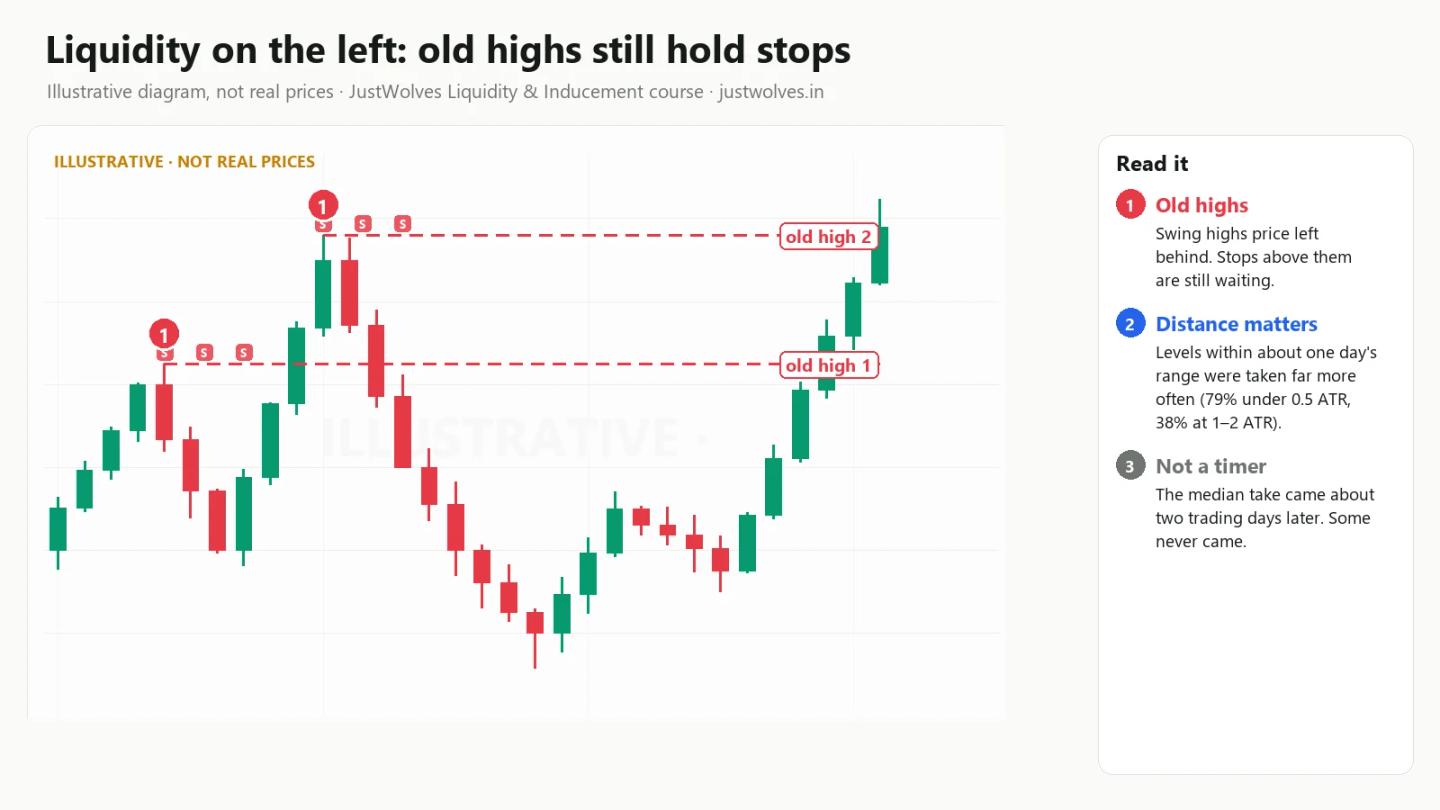
But stops do not expire. A trader who sold short below a swing high last Tuesday and placed a stop just above it still has that stop there today, unless price has already traded through it. The same is true of breakout traders with buy-stop orders above that high. Every untouched swing high on your chart is a small pool of buy-side liquidity, and every untouched swing low is a pool of sell-side liquidity, no matter how old it is.
When you scroll left, those levels are the ones that stick out: a spike high that price never revisited, a low that was made once and then left behind. That is all "liquidity on the left" means. It is the same liquidity as before, only older.
Why would price go back for it? The idea from Lesson 4 applies: large orders need the other side. A big buyer needs sellers, and a pool of buy stops above an old high is a ready supply of market orders on the far side of a big sell. Whether that explanation is complete or not, the practical question is simple, and we can measure it: once a high or low has been left behind, how often does price come back and take it?
2. How we defined an old high or low
To answer that with real numbers, we needed a rule that anyone could repeat. Here it is:
- The swing. A confirmed 1-hour swing high or swing low on gold: a candle with a higher high (or lower low) than the two candles before it and the two after it. This is the same swing rule used throughout this course.
- Old means untouched for a day. If any of the next 24 hourly candles traded through the level, it was not an old level; it was taken while it was still fresh. Only swings that survived a full trading day untouched counted. (Gold pauses for an hour each day at 17:00 New York time, so 24 hourly candles cover 25 clock hours.)
- The distance. At the 24-hour mark (the close of the 24th hourly candle), we measured how far the last close was from the level, in units of daily ATR (the average daily range over the last 14 trading days). A distance of 0.5 ATR means the level was half a normal day's range away.
- The outcome. We then followed the hourly candles for five more trading days (120 trading hours). If any candle traded through the level in that window, it counted as taken. If not, it counted as not taken.
Using ATR instead of dollars matters on gold. A $40 distance meant something very different in June, when gold's typical daily range was about $118, than in October, when it was about $78. ATR puts every level on the same scale.
The rule found 227 old levels formed between 1 June and 9 November 2026: 114 old highs and 113 old lows.
3. How often old highs and lows were taken, by distance
| Distance at the 24-hour mark | Old levels | Taken within 5 trading days | Share |
|---|---|---|---|
| Under 0.5 daily ATR | 72 | 57 | 79% |
| 0.5 to 1 daily ATR | 87 | 62 | 71% |
| 1 to 2 daily ATR | 65 | 25 | 38% |
| Over 2 daily ATR | 3 | 1 | 1 of 3 (too few to judge) |
| All | 227 | 145 | 64% |
Gold (XAUUSD), confirmed 1-hour swing levels untouched for 24 hours, MT5 data. Past behaviour only, not a forecast.
A few things in this table matter.
Distance mattered more than anything else. An old level within one day's normal range was taken in roughly three cases out of four. Beyond one day's range, the share dropped to well under half. The magnet is real, but it is a short-range magnet. Price does not reach for every old level on the chart; it mostly reaches for the ones that are already close.
It usually took a couple of days. For the 145 levels that were taken, the median time from the swing forming to the level being traded through was 49 trading hours, and the middle half took between 33 and 75 hours. Remember the first 24 of those hours are the waiting period built into the definition. So "old" in this lesson means days, not weeks.
Lows were taken more often than highs: 81 of 113 old lows (72%) against 64 of 114 old highs (56%). That is not a rule about lows. Gold spent long stretches of this period falling, especially from late September into November, and in a falling market the old lows below price are the ones in the path. The lesson to take from it is that old levels in the direction of the trend were more likely to be reached. Do not read it as "lows are weaker than highs".
4. Real chart: an old high taken a week later, 14–21 July 2026
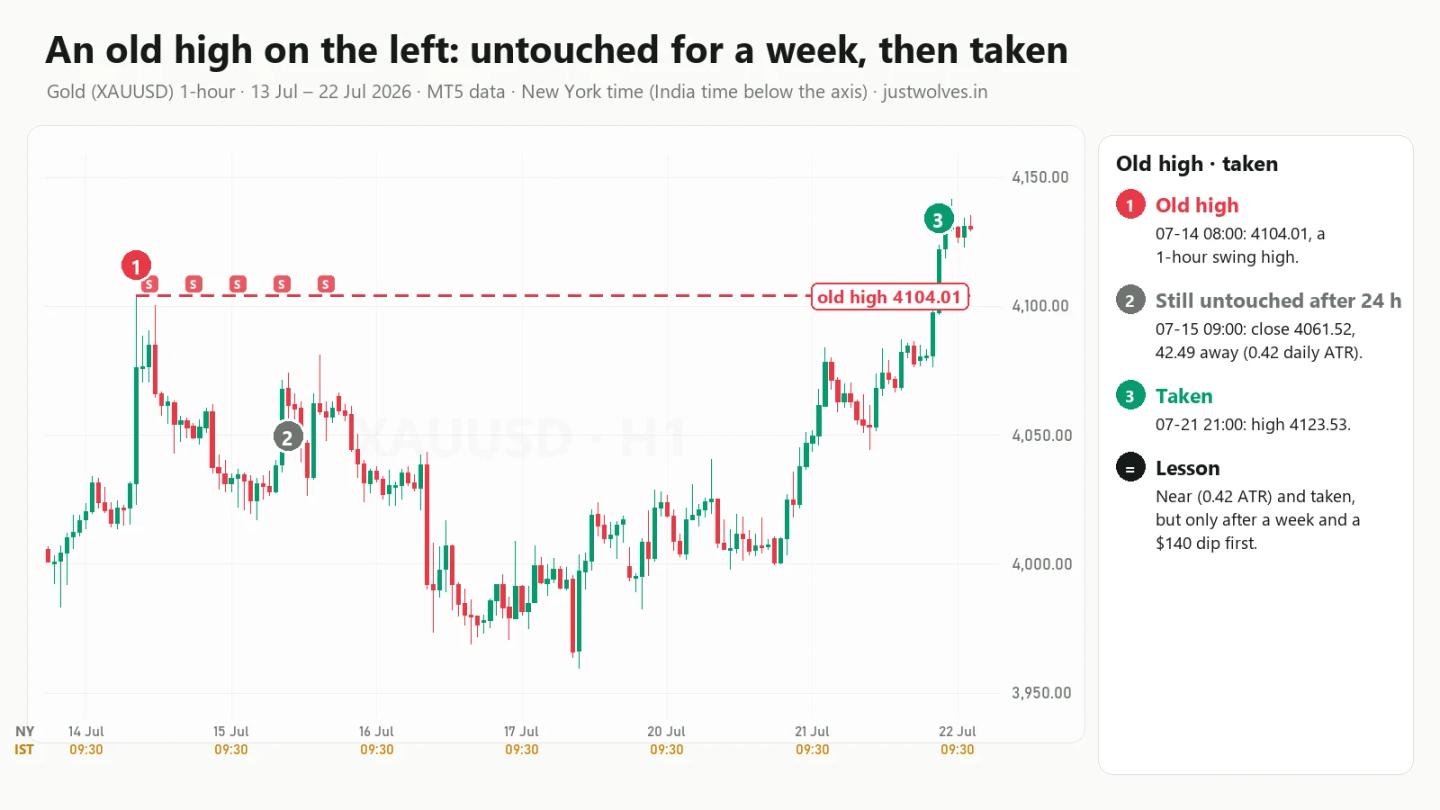
You have seen the end of this story before. In Lesson 1, section 4.4, this level was the previous week high. This time we follow it from the start.
- The high. On Tuesday 14 July, in the 15-minute candle that opened at 08:30 New York time (18:00 India time), gold jumped from about 4030 to 4104.01 in a single candle and then fell back. On the 1-hour chart this is the 08:00 candle, and it made a clear swing high.
- 24 hours later. The 24th hourly candle after the high, at 09:00 on 15 July, closed at 4061.52, $42.49 below the high. That was 0.42 daily ATR: a near old level, in the group that was taken 79% of the time.
- The week in between. Price did not go straight back. It fell to 3959.53 at 09:00 on 17 July, stayed below 4030 into the weekend, and only climbed back during 20 and 21 July. A trader watching the high every day would have seen nothing happen for several days.
- The take. At 20:30 on 21 July, gold reached 4102.60, just $1.41 short of the old high. In the next 15-minute candle, at 21:00 (06:30 India time on 22 July), it traded through to 4121.51 and closed at 4121.26, above the level.
The old high was taken about a week after it formed. That is longer than the median of 49 trading hours, and it is a useful reminder: an old level can sit on your chart for days, ignored, while price goes the other way first. Being near does not tell you when.
Interactive chart: gold 1-hour, 13–22 July 2026 (MT5 data)
Loading historical candles…
5. Real chart: a nearby old high that was never taken, 9–16 July 2026
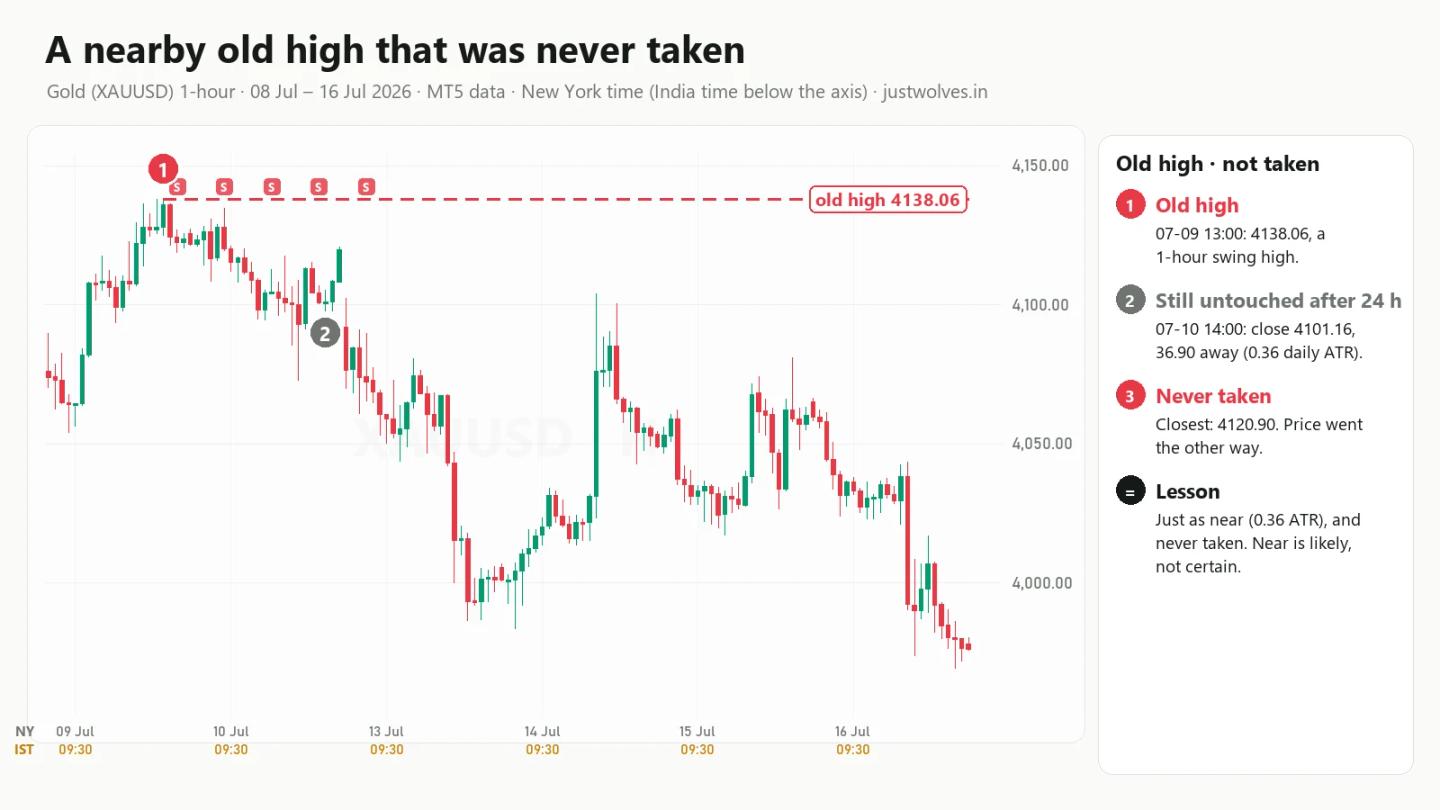
Now the other side: a level that looked just as close and was never taken.
- The high. At the 13:00 hourly candle on Thursday 9 July, gold made a swing high at 4138.06.
- 24 hours later. The 24th hourly candle, at 14:00 on 10 July, closed at 4101.16, $36.90 below it. That is 0.36 daily ATR, even closer than the 14 July example.
- What happened. Later that afternoon, at 16:45, price rallied to 4120.90, still $17 short. After that it turned down. Over the next five trading days gold never got back above 4138.06, and by 15:30 on 16 July it had fallen to 3969.21, about $169 below the old high (the chart ends there). It went lower still, to 3959.53 at 09:00 on 17 July, the same low you saw in section 4.
This is one of the 15 old levels in the "under 0.5 ATR" group (21%) that were not taken. Nothing about the level itself warned you. It was a clean swing high, close to price, and the move simply went the other way. An old level is a possible target, then, not a promise. In Lesson 12 you will add the bigger picture (the daily direction and which side of the range price is trading in) to judge which old levels are more likely to be in the path.
Put the two examples side by side and you can see what the "magnet" idea really means:
| 14 July high (4104.01) | 9 July high (4138.06) | |
|---|---|---|
| Distance after 24 hours | $42.49 (0.42 ATR) | $36.90 (0.36 ATR) |
| Taken within 5 trading days? | Yes, at 21:00 on 21 July | No; closest was 4120.90 |
| What price did first | Fell to 3959.53, then rose | Fell to 3969.21, then 3959.53 |
The statistics tell you that levels like these were usually taken. The charts tell you that you cannot know in advance which ones.
6. Stacked traps: when inducement comes in layers
In Lesson 7 you learned that the first pullback after a strong move is often bait: in 156 of 206 gold dealing ranges (76%), the first pullback level was taken before the move reached its external target. But that raises a question. After the first bait is taken, early traders who were stopped out often try again. They buy the next dip and put their stop under the next small low. Is that second level safe?
We checked. For each of the 156 bait cases from Lesson 7, we looked for a second 15-minute pullback swing that formed after the first bait was taken and before the outcome (the external level or the opposite side of the range being taken). Then we asked whether that second level was also traded through.
| After the first bait was taken (156 cases) | Cases | Share |
|---|---|---|
| A second pullback level formed and was also taken (a double bait, or stacked trap) | 79 | 51% |
| A second pullback level formed and held | 50 | 32% |
| No second pullback swing formed before the outcome | 27 | 17% |
Gold (XAUUSD), 1-hour dealing ranges with 15-minute pullback swings, MT5 data, same cases as Lesson 7.
So in half of all bait cases, the second pullback was bait too. This is what traders call stacked inducement or a double inducement: two (or more) layers of stops placed close together, each one taken in turn.
What happened after the double bait? Of the 79 cases, the move went on to take the external level in 34, and failed (the opposite side of the range was taken) in 44; one case did neither within 48 hours. So a second bait being taken was not a sign that the move was finally about to go. That makes sense when you think about it: a failed move also has to travel through those pullback levels on its way to the other side of the range, so the reversals pick up "double baits" along the way.
7. Real chart: two pullback lows taken, then the move, 13–14 July 2026
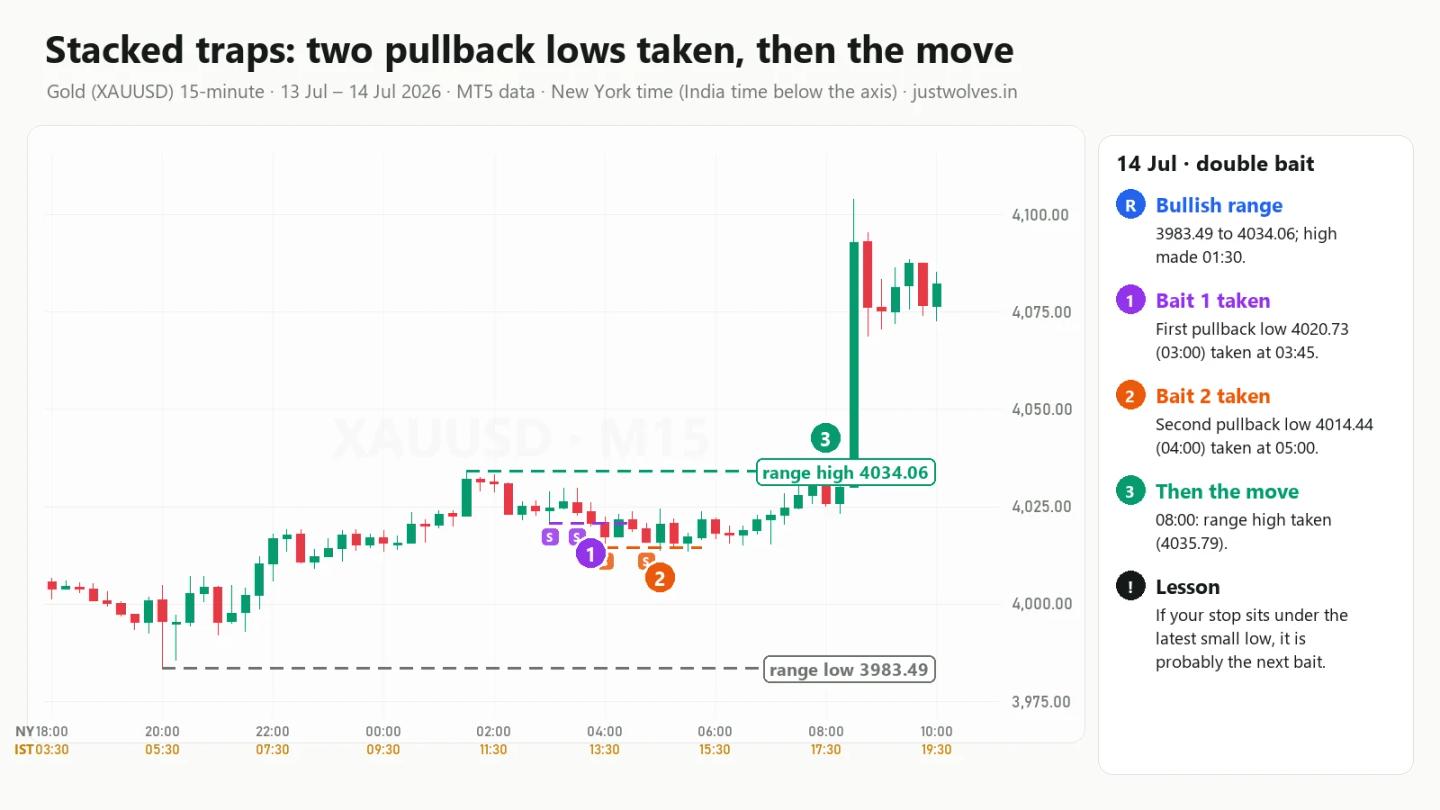
This example happened on the same morning as the old high in section 4, a few hours earlier.
- The range. A bullish dealing range on the 1-hour chart, from 3983.49 (the 20:00 candle on 13 July) to 4034.06. On the 15-minute chart, the high was made at 01:30 New York time on 14 July.
- Bait 1. The first pullback low after the high formed at 4020.73 at 03:00. Early buyers would buy that dip with stops just below. At 03:45 a candle traded down to 4020.15, 58 cents under the low, and those stops were hit.
- Bait 2. Price bounced, and a new 15-minute swing low formed at 4014.44 at 04:00. Here the second wave of buyers, including some who had just been stopped out, would try again. At 05:00 a candle traded to 4013.89, and their stops were hit too.
- The bottom of the shakeout. The lowest price between the first bait and the breakout was 4013.67, at 05:30. That was still about $30 above the range low of 3983.49: the dealing range itself was never in danger.
- The move. Price then climbed, and at 08:00 a candle traded to 4035.79, above the range high. Thirty minutes later came the 08:30 spike to 4104.01 you saw in section 4.
Two layers of stops, about $6 apart, both taken within 75 minutes, and then the move went in the original direction. A trader who bought the first dip with a tight stop was stopped out. A trader who bought the second dip with a tight stop was stopped out too. A trader who waited, or who placed a stop beyond the range structure rather than under the latest small low, was still in when the move came.
Interactive chart: gold 15-minute, 13–14 July 2026 (MT5 data)
Loading historical candles…
8. How to use old highs, old lows and stacked traps
- Scroll left before every session. Mark the untouched swing highs and lows from the last few days on the 1-hour chart. Those, together with the daily, session and weekly levels from Lesson 1, are your liquidity map.
- Measure the distance in ATR, not in dollars. In our sample, levels within one daily ATR were taken roughly three times in four; levels further away were taken less than four times in ten. Focus on the near ones.
- Prefer old levels in the direction of the bigger move. The difference between old lows (72% taken) and old highs (56%) in a mostly falling period shows that the trend decides which old levels are in the path.
- Do not expect the take to be quick. The median was about two trading days, and the 14 July high took a week. An old level is a draw on liquidity, not a timer.
- Assume the second pullback is bait too. It was taken in about half of the bait cases. If your plan needs a stop under the latest small low, your stop is probably too tight.
- Read the reaction when an old level is taken. It is the same question as in Lesson 6: sweep, run or trap? On 21 July, the old high was taken with a close above and price kept rising: a run, not a sweep.
Common mistakes with old highs and lows
- Treating every old level as a target. In our sample 36% were not taken within five trading days, and 21% of even the nearest ones were not.
- Ignoring distance. A level two daily ranges away is a very different proposition from one half a range away.
- Expecting price to go straight there. The 14 July high was taken only after price first fell more than $140 below it.
- Moving your stop to the next small low after being stopped out. That is how stacked traps work. If the first stop was too tight, the second one usually is too.
- Reading "double bait" as a signal. After a second level was taken, moves failed (44 cases) more often than they continued (34).
Homework
On the gold 1-hour chart, scroll back five trading days and mark every swing high and low that price has not traded through since. For each one, write down its distance from the current price in daily ATR. Over the next week, note which levels are taken and how long it takes. Compare your results with the table in section 3.
Practise on the live gold chart
● LiveFrequently Asked Questions
What are old highs and lows in trading?
Swing highs and lows that price made in the past and has not traded through since. Stop orders placed beyond them are still waiting, so they act as pools of liquidity. Traders often call them liquidity on the left.
Why does price go back to old highs and lows?
Because the orders waiting there provide the other side for large trades: buy stops above an old high are market buys that a large seller can sell into. In our gold sample, 64% of old 1-hour levels were taken within five trading days.
Which old highs and lows are most likely to be taken?
The near ones. Levels within half a daily ATR of price were taken 79% of the time in our sample, against 38% for levels one to two ATR away. Levels in the direction of the trend were also taken more often.
What is stacked or double inducement?
When more than one layer of early-entry stops is taken before the real move: the first pullback level is taken, traders re-enter at the next pullback, and that level is taken too. It happened in 79 of the 156 bait cases we studied.
Does a double inducement mean the move will continue?
No. After a second pullback level was taken, the move continued in 34 cases and failed in 44. Use it as a warning about stop placement, not as an entry signal.
Test Your Knowledge
What does "liquidity on the left" mean?
Related lessons
Education only. Not investment advice or a recommendation to trade. JustWolves is not a SEBI-registered adviser. Charts and statistics use historical MT5 chart data for gold from June to November 2026; they describe past behaviour in one market and period and are not a forecast or a record of real trades. Trading forex and commodities involves substantial risk of loss.