Liquidity Sweep vs Breakout: How to Read the Reaction
JustWolves is an educational platform and is not a SEBI-registered investment advisor. Trading financial instruments involves significant risk of loss and may not be suitable for all investors. Past performance is not indicative of future results. Read our full disclaimer →
What you'll learn
- The take of a liquidity level is close to a coin flip on its own.
- The first hour of 15-minute closes sorts most takes into a sweep, a run or a trap.
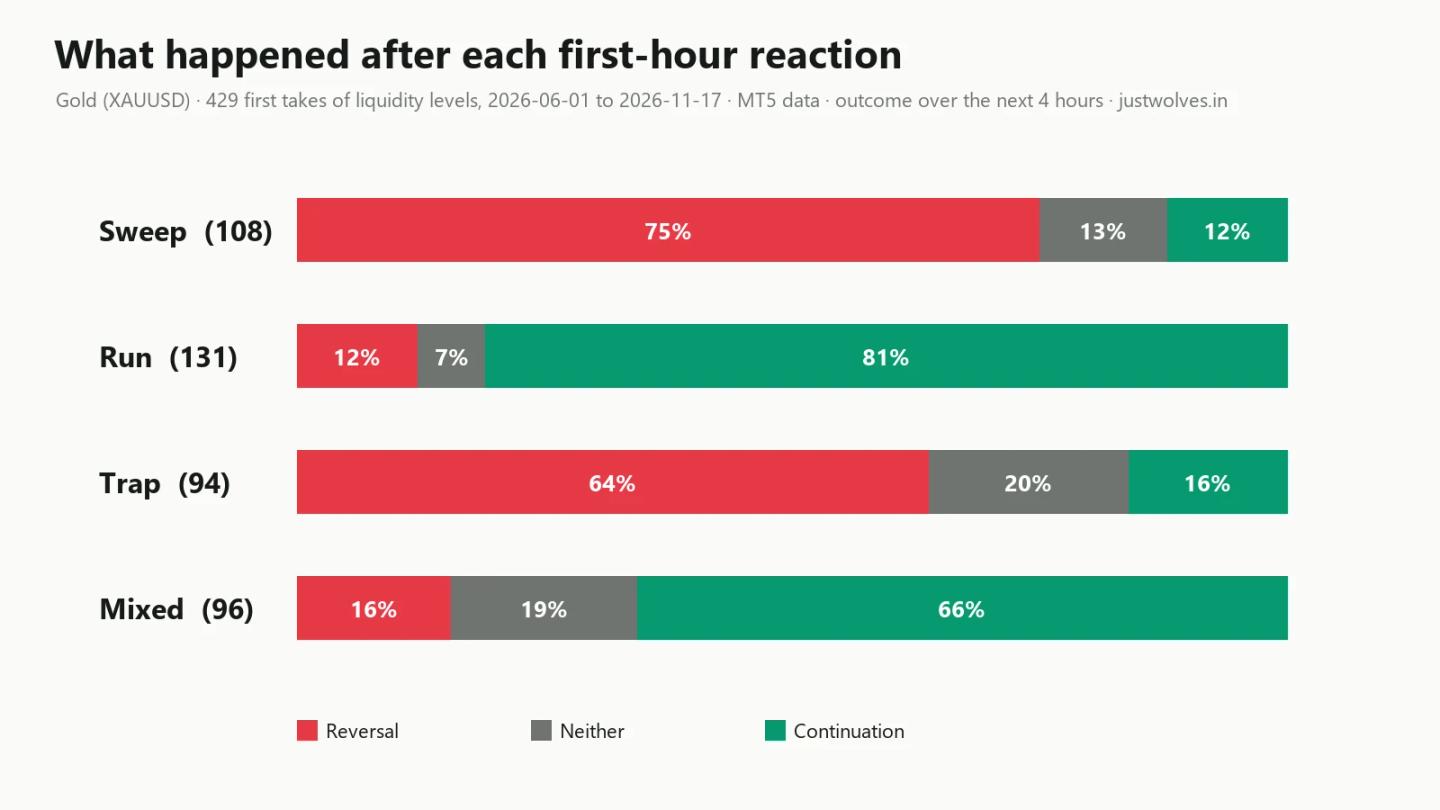
- In 429 gold cases, sweeps reversed 75% of the time, traps 64%, and runs continued 81% of the time.
- No reaction is certain: about one sweep in eight and one run in eight went the other way.
- Use the reaction together with the liquidity map, the time of day and a structure shift, never alone.
In this article · 12 sections
Liquidity sweep vs breakout is one of the hardest calls in trading, because both look the same at the moment price takes a level: a candle trades through an obvious high or low. The difference shows up in the reaction that follows. This lesson defines three reactions you can read in the first hour (a sweep, a run and a trap), shows what happened after each one in 429 real cases on gold from MetaTrader 5 (MT5) between June and November 2026, and walks through four real charts, including a sweep that failed.
What you will learn
- Why the take itself tells you very little
- The three reactions: sweep, run and trap
- What happened after each reaction in 429 real cases
- Real chart: a sweep, 10 July 2026
- Real chart: a run, 22 July 2026
- Real chart: a trap, 9 June 2026
- When a sweep fails: 8 September 2026
- A reaction checklist, common mistakes, FAQ and quiz
1. Why the take itself tells you very little
In the first five lessons you learned where liquidity sits and when it tends to be taken. The obvious next question is: once price takes a level, will it reverse or keep going?
The take candle alone barely answers it. We found the first time price traded through each of these levels between 1 June and 17 November 2026: the previous day high and low, the previous week high and low, and the Asian and London session highs and lows from Lesson 1. That gave 429 takes. Over the following hours:
- 172 (40%) reversed, moving at least two times the 15-minute ATR back inside the level;
- 197 (46%) continued, moving at least two times ATR beyond it;
- 60 (14%) did neither.
Without more information, a take is close to a coin flip. The information you need comes in the next hour.
2. The three reactions: sweep, run and trap
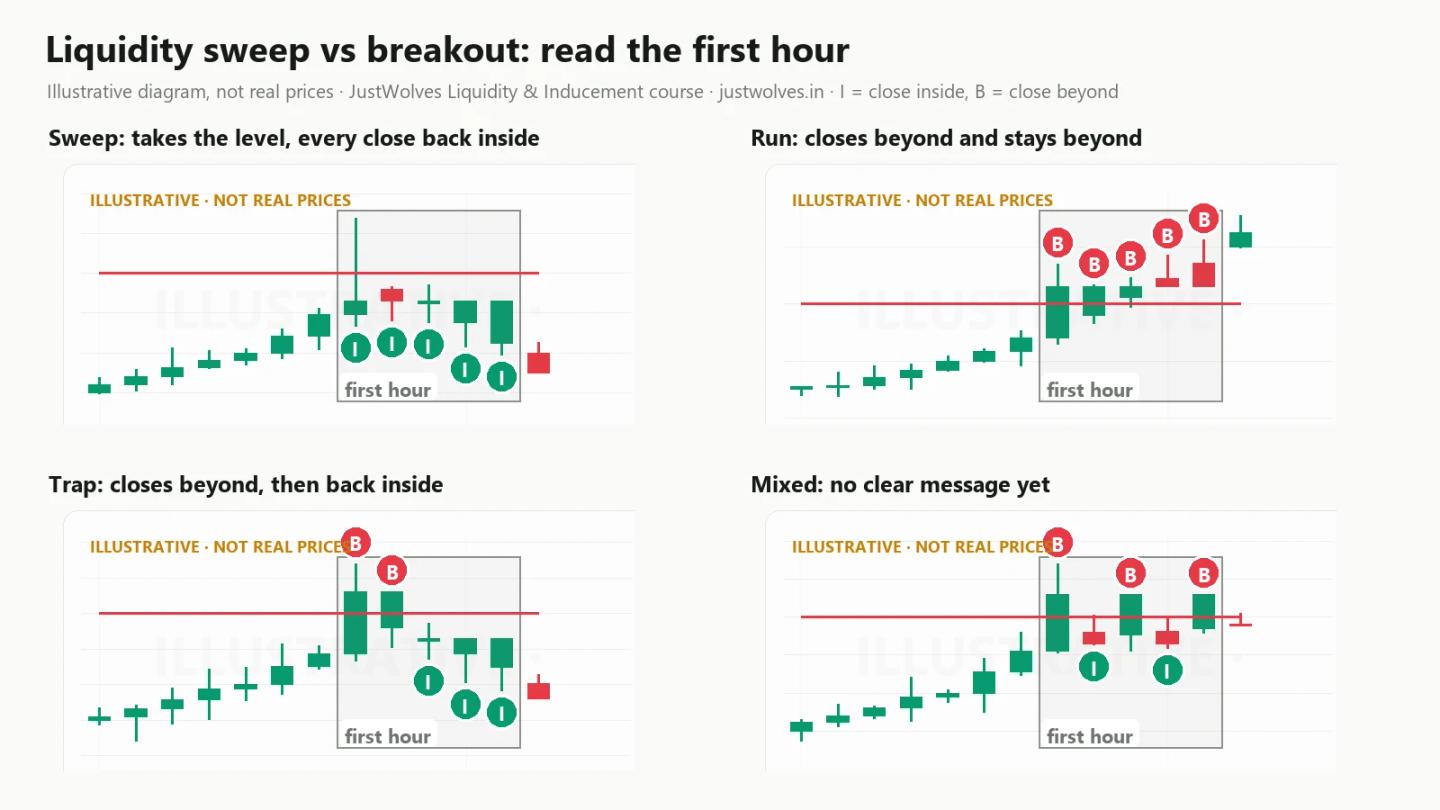
We look at the take candle and the four candles after it on the 15-minute chart: one hour in total. Each take falls into one of these reactions:
| Reaction | What you see in the first hour | What it suggests |
|---|---|---|
| Sweep | The take candle closes back inside the level, and none of the next four candles closes beyond it | The orders beyond the level were filled, and price was rejected |
| Run | The take candle closes beyond the level, and at least three of the next four candles also close beyond | Price accepted the new area |
| Trap | At least one of the first three candles closes beyond, but the fifth candle closes back inside | A breakout that did not hold: breakout traders are now trapped |
| Mixed | Anything else | No clear message yet |
These are the same ideas you met in Lessons 1 and 2 (closing back inside versus closing beyond), made precise and measured over a fixed window. A sweep is what Lesson 1 called "taken, closed back inside". A run is what happened on the failed example of 22 July. A trap is the fake breakout from Lesson 2, but caught one hour later.
3. What happened after each reaction in 429 real cases
| Reaction | Cases | Reversal | Neither | Continuation |
|---|---|---|---|---|
| Sweep | 108 | 81 (75%) | 14 (13%) | 13 (12%) |
| Run | 131 | 16 (12%) | 9 (7%) | 106 (81%) |
| Trap | 94 | 60 (64%) | 19 (20%) | 15 (16%) |
| Mixed | 96 | 15 (16%) | 18 (19%) | 63 (66%) |
| All takes | 429 | 172 (40%) | 60 (14%) | 197 (46%) |
Reversal and continuation mean a move of at least two times the 15-minute ATR (back inside or beyond the level, respectively), whichever came first in the four hours after the reaction hour. Gold (XAUUSD), MT5 data. A description of past behaviour, not a trading system.
What this shows:
- A sweep reversed three times out of four. That is a big change from the 40% you get by looking at the take alone.
- A run continued four times out of five. When price closes beyond a level and stays there, the take was usually the start of a move, not a trap.
- A trap reversed nearly two times out of three. Breakouts that fail within the hour often turn into a move the other way.
- Mixed reactions leaned towards continuation. When the first hour gave no clear sweep, run or trap, the breakout side won about two times in three in this sample.
Two limits to keep in mind. First, every reaction needs an hour to form, so part of the move may already be gone by the time you can name it. Second, no reaction was certain: 12% of sweeps continued anyway, and 12% of runs reversed. The next sections show one of each kind, plus a sweep that failed.
4. Real chart: a sweep, Friday 10 July 2026
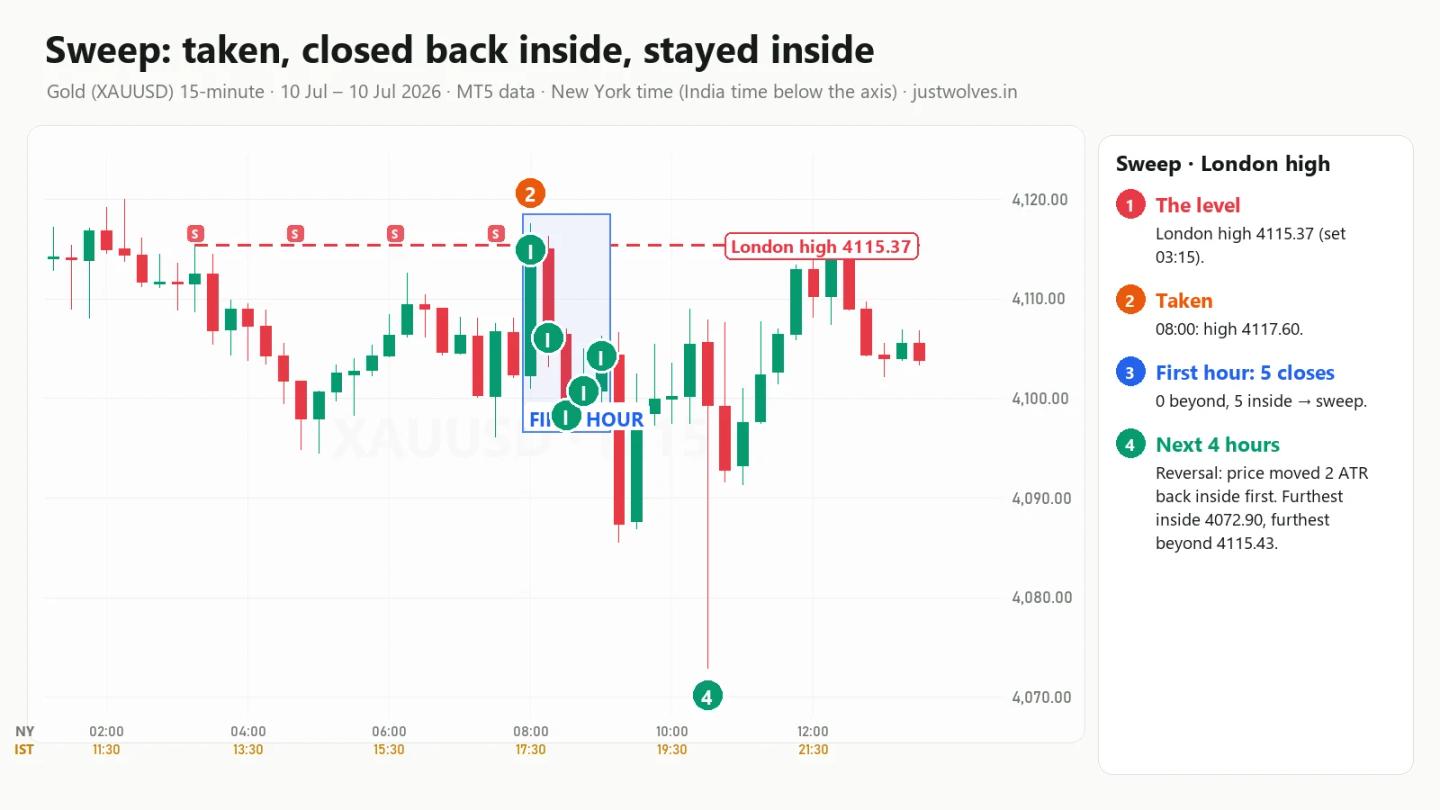
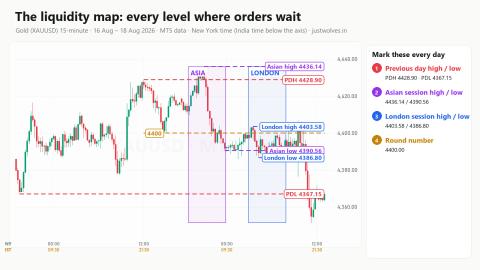
You saw this level in Lesson 1, section 4.6.
- The level. The London session high, 4115.37, set at 03:15 New York time.
- The take. At 08:00 a candle traded to 4117.60 and closed back inside at 4114.92.
- The first hour. All five closes from 08:00 to 09:00 were below the level (4114.92, 4106.07, 4098.32, 4100.75, 4104.25). That is a sweep.
- What followed. Ninety minutes later gold was at 4072.90, over $40 lower (the same day you met in Lesson 1, section 4.6). Later, at 12:30, price drifted back up to 4115.43, just six cents above the old high, but by then the reversal had already happened.
5. Real chart: a run, Wednesday 22 July 2026
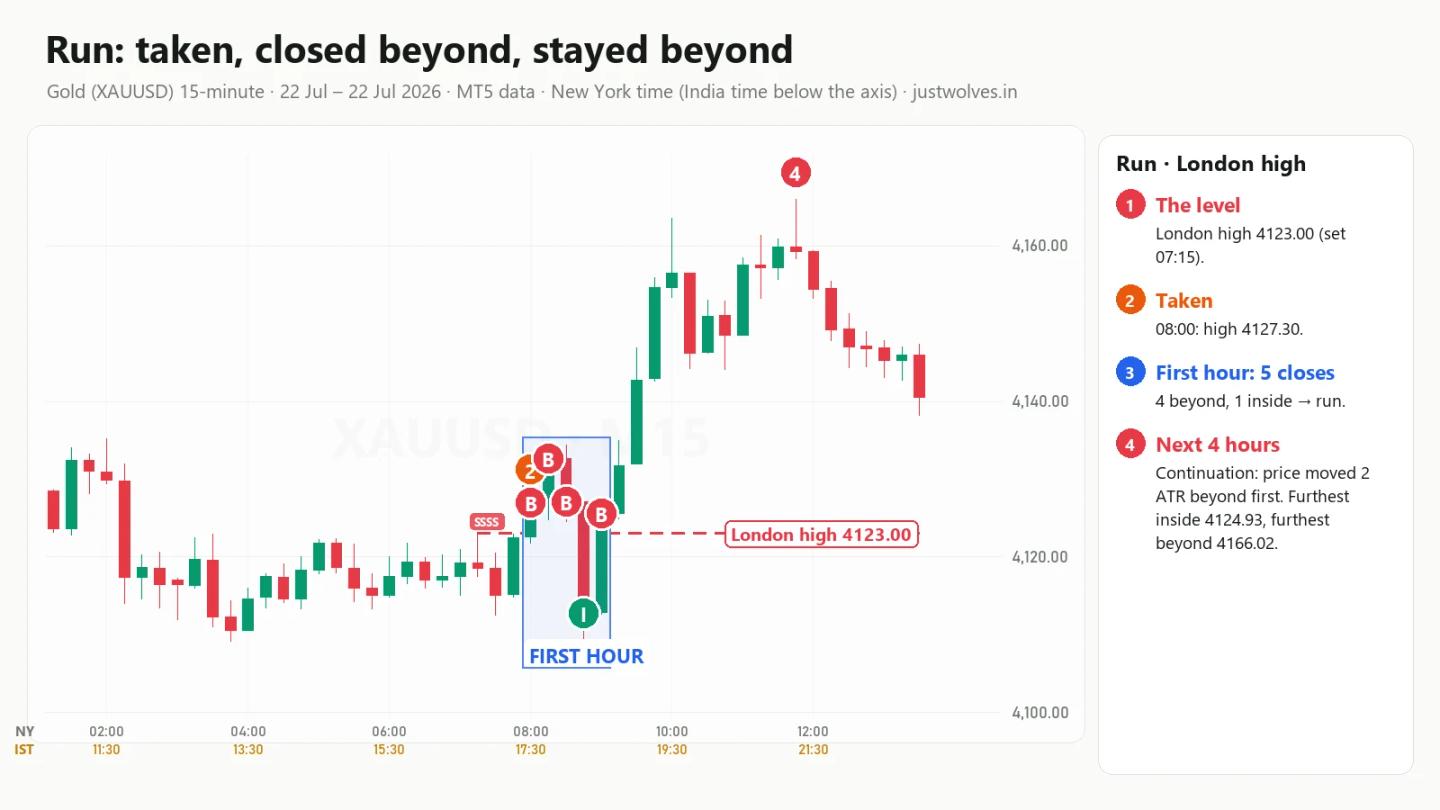
This is Lesson 1's failed example. The equal highs at 4123.00 were also the London session high.
- The take. At 08:00 a candle traded to 4127.30 and closed beyond the level at 4126.99.
- The first hour. Closes at 4126.99, 4132.68, 4127.15, 4112.79 and 4125.65. Four of five were above 4123.00. The one close inside, at 08:45, was the sharp dip that took the London low, the sell-side sweep you saw in Lesson 1, section 4.6. This is a run.
- What followed. Gold kept climbing for almost four hours and was at 4166.02 at 11:45.
A trader who treated the 08:00 take as a sweep, because "liquidity was taken", was fighting a run. The first-hour closes said so.
6. Real chart: a trap, Tuesday 9 June 2026
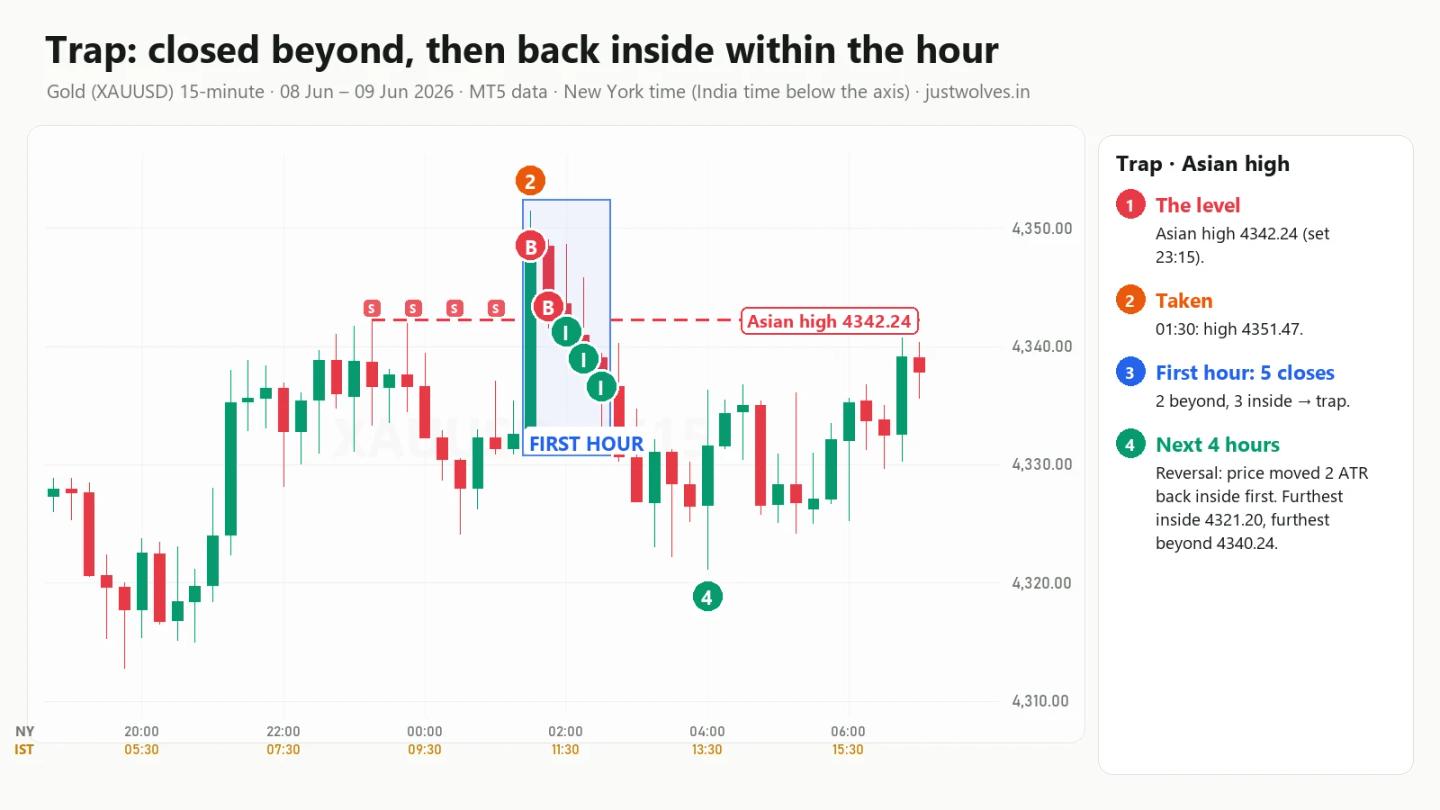
- The level. The Asian high, 4342.24, set at 23:15 New York time on 8 June.
- The take. At 01:30 a strong candle traded to 4351.47 and closed above the level at 4348.53. It looked like a clean breakout.
- The first hour. Closes at 4348.53, 4343.41, then 4341.29, 4338.98 and 4336.62. The breakout held for two candles and then slipped back inside. This is a trap.
- What followed. In the next four hours price never traded back above the level (its highest point was 4340.24), and it fell to 4321.20 by 04:00, about $21 below the level, nearly three times the ATR.
Later that day the bigger picture took over: at 09:45 gold took the previous day high, which you saw in Lesson 1, section 4.3, before the large fall into the dealing range of Lessons 3 and 4. A reaction tells you about the next few hours, not the whole day.
7. When a sweep fails: Tuesday 8 September 2026
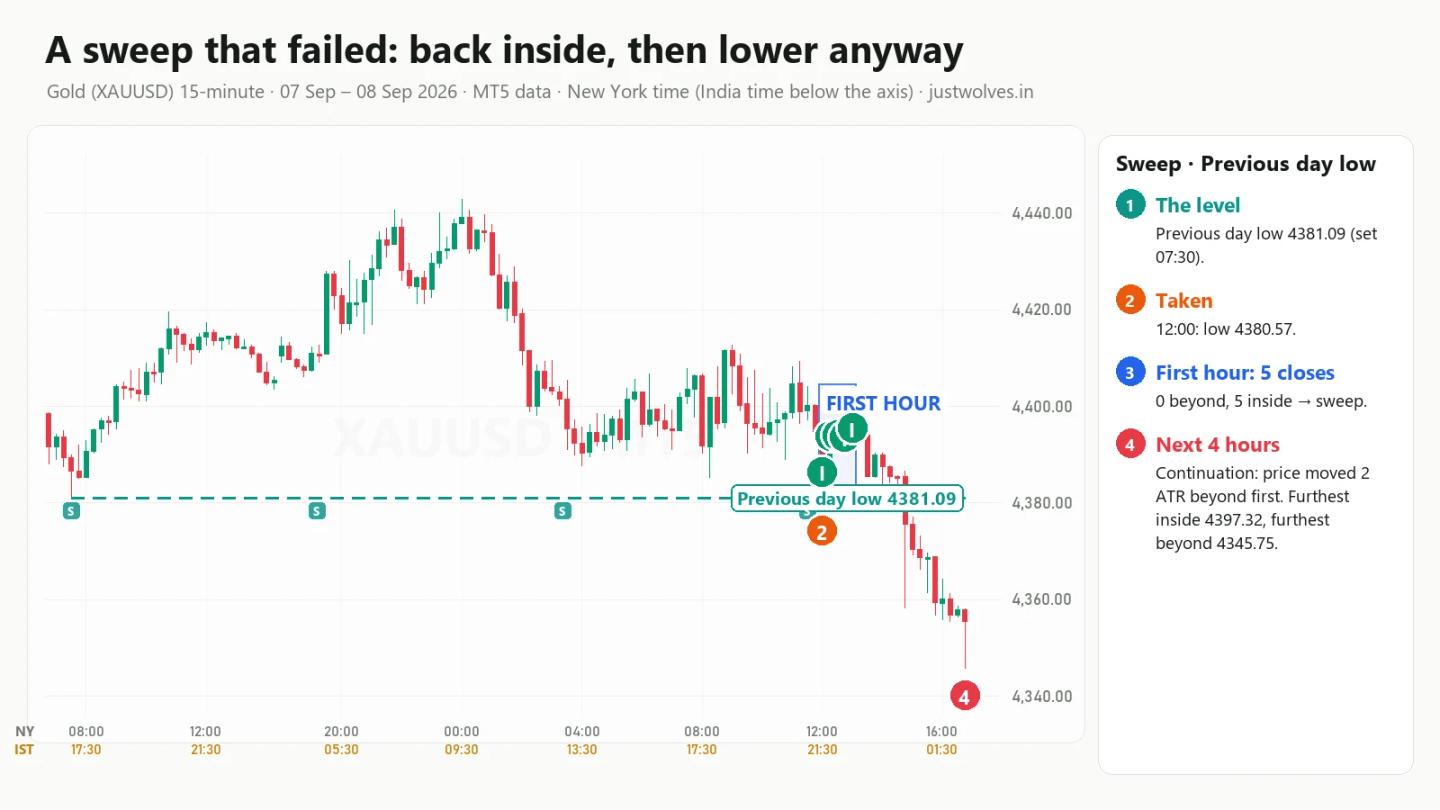
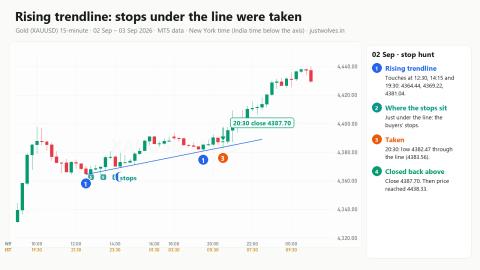
This is the same day as the early fake move in Lesson 5.
- The level. The previous day low, 4381.09, set at 07:30 on 7 September.
- The take. At 12:00 a candle dipped to 4380.57, only 52 cents below the level, and closed back inside at 4386.43.
- The first hour. All five closes were above the level, and price even bounced to 4397.32 by 13:15. Textbook sweep.
- What followed. Instead of rallying, gold turned lower again and fell to 4345.75 by 16:45, more than $35 below the level.
Why might this sweep have failed? The take was very small (52 cents), it came in the New York afternoon on a day that had already broken down from its Asian range, and the bounce never got close to the day's earlier highs. None of these is a rule, but together they show that the reaction is one input, not the whole decision. This is the kind of case our when SMC setups fail lesson is about.
8. A reaction checklist
- Know the level before price gets there: which liquidity it is, and when it formed (Lessons 1 to 5).
- Mark the take candle when price first trades through it.
- Watch five 15-minute closes: the take candle and the next four.
- Name the reaction: sweep, run, trap or mixed, using the table in section 2.
- Lean with the evidence: in our sample, sweeps and traps mostly reversed, runs and mixed reactions mostly continued.
- Look for what argues against it: a tiny take, a day already trending hard the other way, a scheduled news release.
- Wait for structure before acting. Lesson 11 shows how a market structure shift turns a reaction into a trade plan.
Common mistakes when reading the reaction
- Deciding on the take candle. On its own, a take reversed 40% of the time and continued 46% of the time in our sample.
- Calling every take a sweep. On 22 July the London high was taken and price ran $43 higher.
- Ignoring one bad close. In a run, a single close back inside (like 08:45 on 22 July) does not cancel the reaction; count all five.
- Trusting a sweep blindly. On 8 September a clean sweep still failed.
- Holding the read too long. A reaction describes the next few hours, not the whole day, as 9 June showed.
Homework
Pick five liquidity levels from last week (a previous day high or low, an Asian or London high or low). For each one, find the first candle that traded through it, write down the five closes from that candle onwards, name the reaction, and then check what happened over the next four hours.
Practise on the live gold chart
● LiveFrequently Asked Questions
How can I tell a liquidity sweep from a breakout?
Watch the first hour after the level is taken. In our gold data, when the take candle closed back inside and stayed inside for the next four candles (a sweep), price reversed 75% of the time. When it closed beyond and stayed beyond (a run), it continued 81% of the time.
What is a liquidity trap?
A breakout that closes beyond a level for a candle or two and then closes back inside within the hour. In 94 cases, traps reversed 64% of the time.
Is a liquidity sweep a reversal signal?
It is evidence for a reversal, not a signal on its own. In our sample about one sweep in eight continued anyway, as on 8 September 2026.
Why one hour of 15-minute candles?
It is long enough for the market to show whether it accepts or rejects the new price, and short enough to still act on the move. It is our measuring rule; other windows give similar ideas with different numbers.
Does this work on other markets?
These numbers are for gold on MT5 data from June to November 2026. The idea of reading the reaction applies elsewhere, but test it on your own market before relying on it.
Test Your Knowledge
On its own, what did a take of a liquidity level tell us in 429 cases?
Related lessons
Education only. Not investment advice or a recommendation to trade. JustWolves is not a SEBI-registered adviser. Charts and statistics use historical MT5 chart data for gold from 1 June to 17 November 2026; they describe past behaviour in one market and period and are not a forecast or a record of real trades. Trading forex and commodities involves substantial risk of loss.