
Equal Highs and Equal Lows: Obvious Levels and Liquidity
JustWolves is an educational platform and is not a SEBI-registered investment advisor. Trading financial instruments involves significant risk of loss and may not be suitable for all investors. Past performance is not indicative of future results. Read our full disclaimer →
What you'll learn
- Equal highs and lows are two or more swing extremes at nearly the same price
- Because they're obvious, many stops and breakout orders tend to sit just beyond them
- SMC often treats them as targets price is likely to reach
- Judge 'equal' with a tolerance in pips or as a share of the average range
- When taken, watch the close: a wick and reversal suggests a sweep; a strong close beyond suggests a breakout
In this article · 15 sections
A double top or double bottom is one of the oldest chart patterns. In Smart Money Concepts, the same shape is read differently: two equal highs aren't just resistance, they're an obvious level with a likely cluster of orders above it. This lesson explains how to spot equal highs and lows, why SMC treats them as targets, and how to handle them in your own trading.
What You Will Learn
- What equal highs and equal lows are
- Why SMC treats them as dense liquidity
- How to decide whether two levels are 'equal'
- How to plan trades around them
Before You Start
Read What Is Liquidity in SMC? first.
What Equal Highs and Lows Are
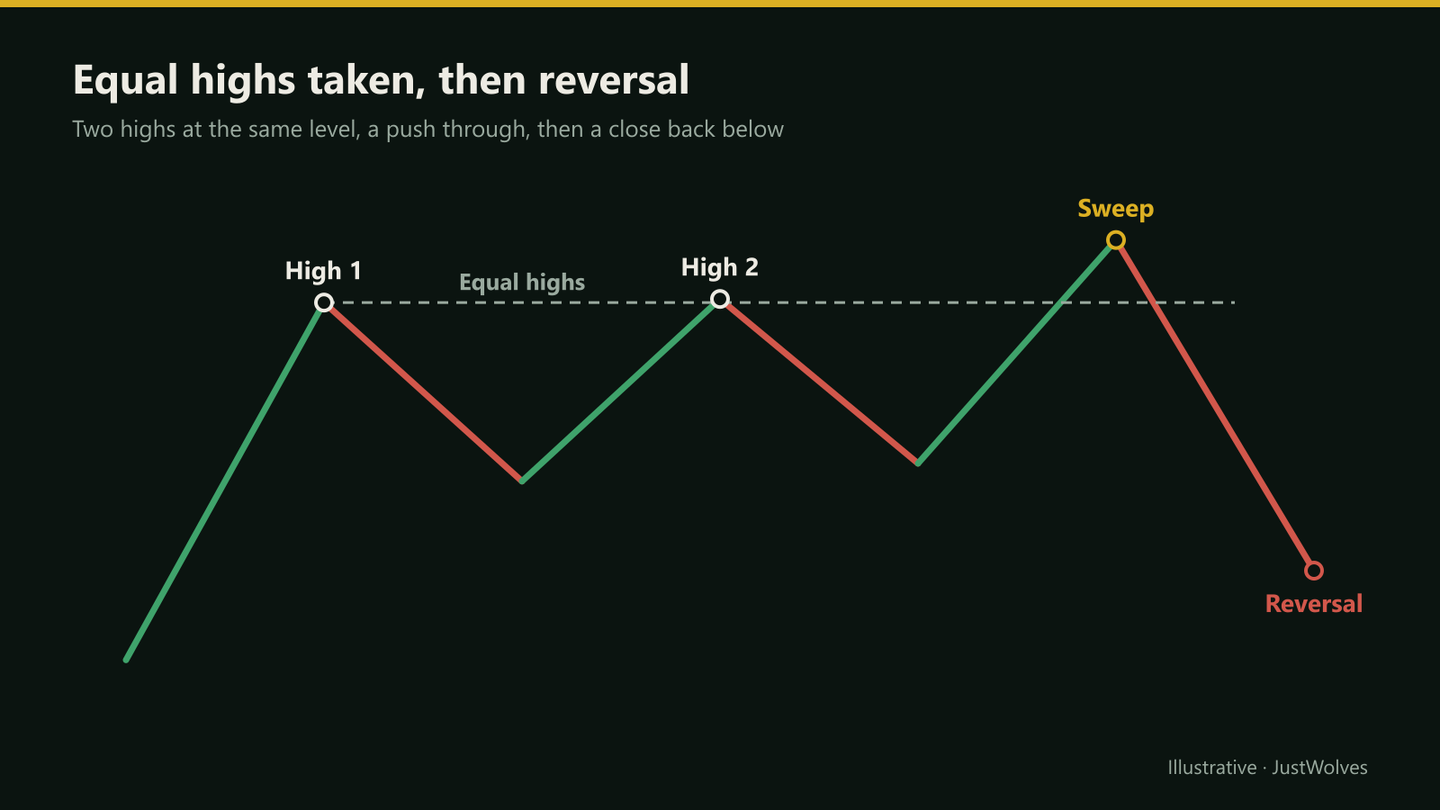
Equal highs form when price makes two or more swing highs at nearly the same level, a flat ceiling on the chart. Equal lows are two or more swing lows at nearly the same level, a flat floor.
In classical analysis these are double or triple tops and bottoms, read as resistance and support. SMC reads them as liquidity: so obvious that many traders place stops and breakout orders just beyond them.
Why SMC Treats Them as Targets
- Visibility: almost anyone looking at that timeframe can see them.
- Repeated tests: each test adds traders who sold the level with stops just above (or bought with stops just below).
- Breakout orders: traders waiting for a break place buy-stops above equal highs or sell-stops below equal lows.
- Classical caution: as a classical idea, a level tested several times may also be weakening, since each test absorbs some of the opposing orders.
SMC goes further and claims large participants deliberately drive price to these levels. That's an interpretation. What you can test is how often price reaches equal highs or lows on your pairs and timeframes, and what it does afterwards.
How Equal Is 'Equal'?
Two highs rarely match to the pip. Set a tolerance and use it every time: for example, within 2–3 pips on a 15-minute EUR/USD chart, within 5–10 pips on a 4-hour chart, or within about 10% of the average candle range on that timeframe.
Highs further apart than your tolerance are simply two separate highs. Writing the tolerance down prevents you from 'seeing' equal highs wherever it suits your trade.
A Real Example, Step by Step
Below is an actual USD/JPY session where equal lows formed overnight and were swept at the New York open. Step through it candle by candle. The last step is the important one: it shows why spotting equal lows correctly is not the same as having a good trade.
Real equal lows swept at the New York open: USD/JPY 1H, 15 October 2026
Step 1 of 5
Equal lows form in the Asian session
At 01:00 and 03:00 UTC (10:00 and 12:00 in Tokyo), USD/JPY bottomed at 157.577 and 157.589, just 1.2 pips apart. Within any sensible tolerance, those are equal lows.
- What to observe
- A flat floor that every trader on this chart can see.
- Condition
- Sell stops from longs, and breakdown sell-stops, gather below 157.577.
Explore USD/JPY around 15 October 2026
Loading historical candles…
When They're Taken: Sweep or Breakout?
| What you see | Likely reading | What traders often do |
|---|---|---|
| Wick above, candle closes back below | Sweep: stops triggered without follow-through | Look for a short after a lower-timeframe CHoCH or MSS |
| Strong close above, little wick, fair value gap left | Breakout or displacement | Look for a long on a pullback to the broken level |
| Close above, then close back below within a few candles | Failed breakout | Treat as a sweep, with a stop above the high of the move |
| Price never reaches them | Level remains untested | Keep them marked as a potential target |
What Our Data Shows
How often do equal highs and lows actually get taken, and what happens when they do? JustWolves tested this on about six months of 1-hour candles (May to November 2026) for EUR/USD, GBP/USD, USD/JPY and gold. Rules: two swing highs (or lows) within 10% of the average hourly candle range, at least five hours apart, with nothing in between trading beyond them. We then watched the next 48 hours.
| Measure | Result |
|---|---|
| Taken within 48 hours | 73% |
| First candle through closed back inside (sweep) | 53% of those taken |
| First candle through closed beyond (break) | 47% of those taken |
| After a sweep, price reached the swing between the two levels within 24 hours | 44% of sweeps (54 sweeps) |
The data supports the core SMC idea: equal levels attract price, and roughly three in four were reached within two days. It does not support the idea that equal highs and lows are mainly reversal signals. When they were taken, a sweep and a genuine break were almost equally likely. Even after a clean sweep, price reached the opposite swing less than half the time.
This is why the practical rules in this lesson matter more than the pattern itself: wait for the close before classifying, use equal levels as targets more often than as entries, and keep your stop beyond the obvious cluster rather than inside it.
Step by Step: Trading Around Equal Highs and Lows
A planning routine
Step 1: Mark them
Using your written tolerance, on your analysis timeframe.
Step 2: Note the context
Are they in the direction of the higher-timeframe trend, or against it?
Step 3: Don't trade the first touch blindly
Wait for price to reach them and show its hand.
Step 4: Classify the reaction
Sweep or breakout, using candle closes.
Step 5: Plan the trade
Entry after confirmation, stop beyond the extreme of the move, target the opposite liquidity.
Practical Example
On a 15-minute EUR/USD chart, Nandini sees two highs at 1.0912 and 1.0914, within her 3-pip tolerance: equal highs. The 4-hour trend is down, so she's interested in a short if they're swept.
During London, price spikes to 1.0921, then the 15-minute candle closes at 1.0908, back below both highs. A 5-minute bearish MSS follows. She sells at 1.0910 with a stop at 1.0925, above the sweep high, targeting the equal lows at 1.0870: 15 pips of risk for 40 of reward. Had price closed strongly above 1.0914 and held, she would have stood aside.
Exactly Equal, Relatively Equal, and Stepped Levels
Real charts rarely produce two highs to the exact pip. Traders usually distinguish three shapes:
- Exact or near-exact equal highs/lows: within your tolerance. The cleanest form and the most obvious to other traders.
- Relatively equal highs/lows: slightly further apart, but still forming a visible ceiling or floor. Many educators include these; if you do, widen your tolerance deliberately and write it down.
- Stepped levels: a series of highs each slightly higher than the last, or lows each slightly lower. Each one adds stops just beyond it, so the cluster grows as the steps continue. The EUR/USD example in Liquidity Sweep vs Displacement shows five stepped highs within 5 pips.
Whichever shapes you include, apply the same definition in your backtests and your live trading. A definition that changes depending on the trade you want is not a definition.
Common Mistakes
- Selling the second touch of equal highs with a stop just above them, inside the most obvious cluster.
- Calling any two highs 'equal' without a tolerance.
- Assuming a sweep before seeing the close.
- Ignoring the higher-timeframe trend.
- Using equal levels on thin, illiquid charts.
Professional Insight
Experienced traders often use equal highs and lows more as targets than as entry points. If price is trending down towards equal lows, those lows are a logical place to take profit, whatever happens next. That use doesn't depend on predicting a sweep.
Risk Considerations
- Equal levels break cleanly in strong trends.
- Spikes during news can sweep and continue unpredictably.
- Stops beyond sweep extremes can be wide; size accordingly.
Important Terminology
| Term | Meaning |
|---|---|
| Equal highs (EQH) | Two or more swing highs at nearly the same price. |
| Equal lows (EQL) | Two or more swing lows at nearly the same price. |
| Tolerance | How close two levels must be to count as equal. |
| Sweep | A move through a level that closes back on the original side. |
| Double top / bottom | The classical name for the same shape. |
What are equal highs in trading?
Two or more swing highs at nearly the same price, forming a flat ceiling on the chart.
Why are equal highs and lows important in SMC?
Because they're obvious, many stops and breakout orders are likely to sit beyond them, making them potential targets for price.
How close do highs need to be to count as equal?
Set a tolerance, such as a few pips on lower timeframes or about 10% of the average candle range, and use it consistently.
Will price always take equal highs or lows?
No. Price often reaches them, but not always, and when it does it may reverse or break through.
How do I tell a sweep from a breakout?
A sweep wicks through and closes back; a breakout closes strongly beyond and holds, often leaving a fair value gap.
How often are equal highs and lows taken?
In our test of 140 equal-level pairs on 1-hour charts across four markets, 73% were traded through within 48 hours. Of those, 53% were sweeps (closed back inside) and 47% were genuine breaks.
Are equal highs a sell signal?
Not on their own. Equal highs mark where buy stops are likely to rest. Price may sweep them and reverse, or break them and continue. In our data, both outcomes were about equally likely, so wait for the close and confirmation before acting.
Practical Exercise
Study equal levels on your pair.
Your task
Step 1: Write a tolerance
For the 15-minute and 4-hour charts.
Step 2: Find 20 examples
Of equal highs or lows.
Step 3: Record the outcome
Not reached, swept and reversed, or broke and held.
Step 4: Note the context
With or against the higher-timeframe trend? Does it change the outcome in your sample?
Check Your Understanding
Equal lows are best described as:
Related Lessons
Previous: What Is Liquidity in SMC?. Next: Liquidity Sweep vs Displacement. See also Inducement and Fake Breakouts.