
Advanced Inducement: Impulse, Correction and Valid Order Blocks
JustWolves is an educational platform and is not a SEBI-registered investment advisor. Trading financial instruments involves significant risk of loss and may not be suitable for all investors. Past performance is not indicative of future results. Read our full disclaimer →
What you'll learn
- Price moves in cycles of impulse, correction and continuation
- A correction is valid only once price breaks the low of the last internal pullback (in a bullish move)
- That break is the candle-level inducement; it validates the preceding high as a main high
- In this model, the zone nearest price (upper order block) is expected to fail; the origin of the impulse (extreme order block) is the entry zone
- It's a precise, testable model, but still a hypothesis: test it before trading it
In this article · 15 sections
This lesson builds a complete, rule-based model from ideas you've already met: structure, internal swings, inducement and order blocks. It's one of the more demanding lessons in the course, because each step depends on the last. The aim is a sequence precise enough to test, which is what separates a useful model from an after-the-fact story.
What You Will Learn
- The impulse–correction–continuation cycle
- Rules for a valid correction
- The candle-level definition of inducement
- Why the model prefers the extreme order block, and the full five-stage sequence
Before You Start
Read Inducement and Fake Breakouts and Internal vs External Structure first. Order blocks are covered fully in lesson 02.03.04.
Impulse, Correction, Continuation
- Impulse: a strong move in the trend's direction. It may contain small internal pullbacks, but (in a bullish impulse) none of them closes below the low of the previous internal pullback.
- Correction: a counter-move that breaks the internal structure of the impulse, i.e. it takes out the low of the last internal pullback.
- Continuation: the next impulse in the original direction, confirmed when price closes above the high made before the correction.
Valid vs Invalid Corrections
In a bullish move, find the last internal pullback within the impulse: the most recent bearish candle or small group of candles. Mark its low.
A correction is valid when price closes below that low, or wicks below it and closes back above (a sweep of it). If the counter-move stays above that low, it's still part of the impulse, and the high hasn't yet been confirmed as a main high.
| Counter-move | Classification | Consequence |
|---|---|---|
| Closes below the last internal pullback low | Valid correction | The prior high becomes a confirmed main high |
| Wicks below that low and closes back above | Valid correction (sweep) | Same |
| Stays above that low | Not a correction yet; still the impulse | No main high yet; zones above are unreliable |
Candle-Level Inducement
In this model, the low of the last internal pullback is the inducement level (often written IDM). When price trades through it, the inducement has occurred: traders who bought the shallow pullback are stopped out, and the high is validated as a main high.
The model's rule is strict: no inducement, no valid structural break. A break of structure that wasn't preceded by an inducement isn't treated as valid, and any order block drawn from it isn't trusted.
Upper vs Extreme Order Block
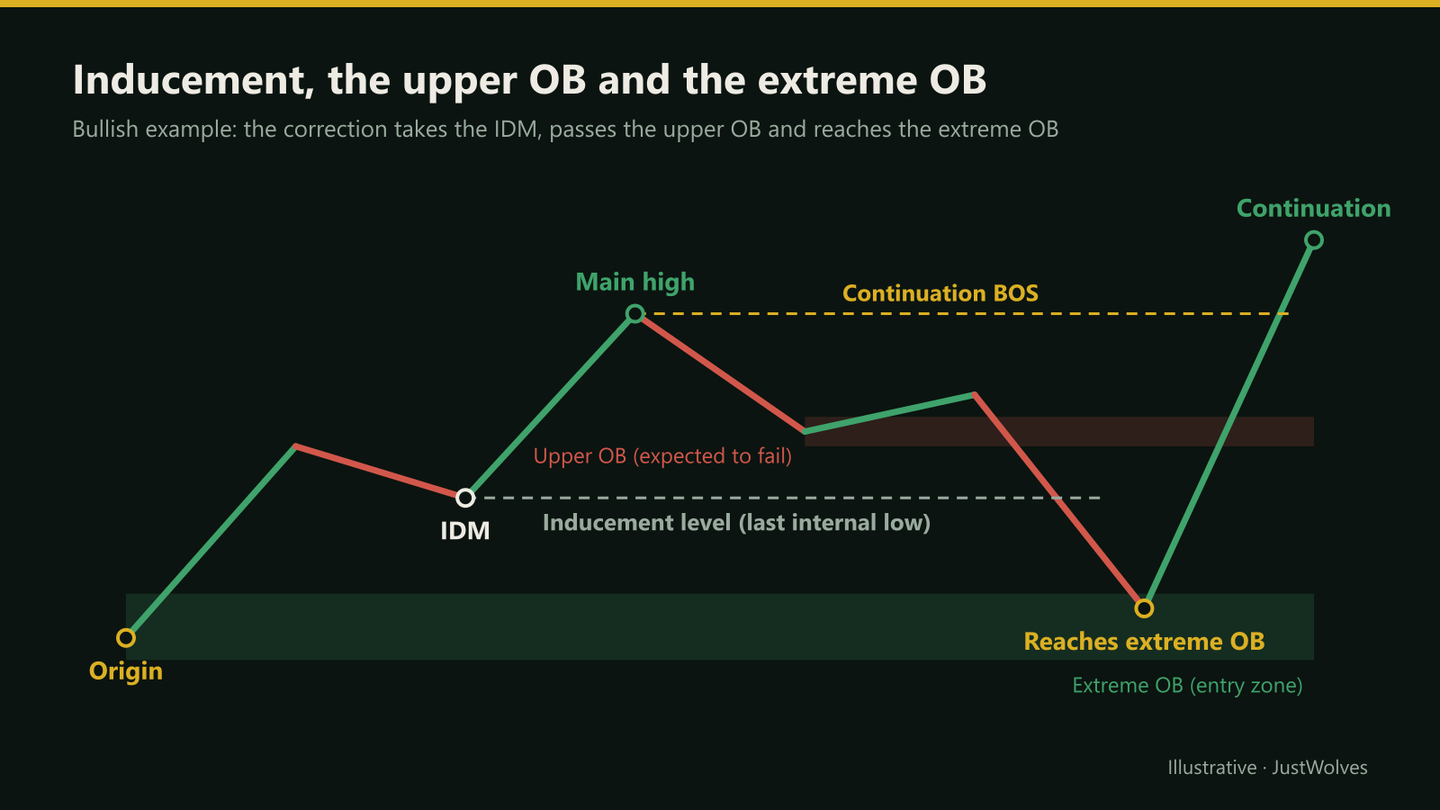
- Upper order block: the zone nearest the current price, formed by the last pullback before the break. It looks like obvious demand, which is why, in this model, it's expected to fail: traders who buy there provide the next pool of stops.
- Extreme order block: the origin of the impulse, the deepest zone. It's where the model expects the correction to end, and it's the preferred entry.
The Five-Stage Sequence on a Chart
The chart below walks through the model: an impulse, an internal pullback that sets the inducement, a correction that takes it and fails the upper order block, and the entry at the extreme order block.
Inducement, the upper order block, and the extreme order block
Step 1 of 5
An impulse from the extreme order block
The last down candle (29.80–30.50) is followed by a strong rally. That candle is the extreme order block, the origin of the impulse.
- What to observe
- The base of the whole move.
- Condition
- Mark it.
Step by Step: The Five-Stage Sequence
Bullish example
Step 1: 1. Impulse and extreme zone
Identify a strong impulse and mark its origin as the extreme order block.
Step 2: 2. Inducement level
Mark the low of the last internal pullback within the impulse.
Step 3: 3. Valid correction
Wait for price to close below, or sweep, that low. The high is now a main high.
Step 4: 4. Entry
Place a buy limit at the top of the extreme order block, stop below it.
Step 5: 5. Target
The main high first, then the next buy-side liquidity above it.
Does Inducement Help? Our Test
The core rule of this model is "no inducement, no valid zone". JustWolves tested a simple, objective version of the idea on about six months of real 1H candles for EUR/USD, GBP/USD, USD/JPY and gold. We took every fair value gap at least 30% of an average candle, and on the first return to the gap checked whether price had, on the way back, taken out a small swing low (for bullish gaps) that formed after the gap: an inducement. We then compared how often the gap held, meaning price moved one average candle away before closing through it.
| Before the revisit | Cases | Gap held |
|---|---|---|
| An inducement low was taken on the way into the gap | 274 | 63% |
| No inducement first | 869 | 59% |
Zones revisited after an inducement held a little more often, 63% against 59%. The direction supports the model, but the difference is modest and could partly be chance. It also comes at a cost: only about a quarter of revisits followed an inducement, so requiring one means far fewer trades and more missed moves.
The upper-versus-extreme order block distinction was not part of this test. If you trade this model, log both zones on every setup, including the ones where price reacted from the upper zone and never reached the extreme one. That record is the only way to know whether waiting for the deeper zone pays for the trades it misses.
Practical Example
Hypothetically, on a 15-minute EUR/USD chart in a bearish trend, an impulse falls from 1.0905 to a new low at 1.0842. Inside it, a two-candle bounce peaks at 1.0868: that's the inducement level. Price then retraces, closes above 1.0868 (inducement taken) and continues up through a small upper supply zone at 1.0872–1.0876.
Divya doesn't sell the upper zone. Her limit is at 1.0896, the bottom of the extreme supply zone at the impulse origin, with a stop at 1.0911 and a first target at the main low, 1.0842: 15 pips of risk for 54 pips to the target. Price reaches 1.0893 and turns down without filling her order. The model worked; she simply missed it, and she logs it as a valid but unfilled setup.
Common Mistakes
- Trading order blocks before the inducement.
- Entering at the upper order block because it's closer.
- Mislabelling the internal pullback, often by picking a candle from an earlier leg.
- Chasing when the extreme zone isn't reached.
- Adopting the model without testing it on your pairs and timeframes.
Professional Insight
The strength of this model is its precision: every step is a rule you can check on a chart. That makes it testable. Run it through 100 historical setups, recording filled and unfilled trades, before deciding whether it deserves real money. The same discipline applies to every SMC model.
Risk Considerations
- Extreme-zone limits often go unfilled, so fewer trades and missed moves are part of the model.
- Strong trends can break through extreme zones too.
- Lower timeframes make the sequence noisier; spreads matter more.
Important Terminology
| Term | Meaning |
|---|---|
| Impulse | A strong move in the trend's direction without a valid internal break. |
| Correction | A counter-move that breaks the impulse's internal structure. |
| Continuation | The next impulse after a correction. |
| Inducement (IDM) | The break of the last internal pullback's extreme, which validates the main high or low. |
| Upper order block | The zone nearest price, expected to fail in this model. |
| Extreme order block | The zone at the impulse's origin; the model's entry zone. |
What is inducement in SMC?
In this model, inducement (IDM) is the low of the last internal pullback inside an impulse. When a correction trades through it, traders who bought the obvious zone are stopped out, which the model treats as the condition for a deeper zone to become valid. At the candle level, the break of that pullback's low (or high, in a downtrend) validates the preceding swing as a main high or low.
What makes a correction valid?
Price closing beyond, or sweeping, the extreme of the last internal pullback in the impulse.
What is an extreme order block?
The zone at the origin of the impulse; in this model, the preferred entry after the inducement.
Why avoid the upper order block?
In this model it's expected to fail, because traders entering there provide the next pool of stops.
Does this model always work?
No. It's a precise hypothesis about price behaviour. Test it on historical data before trading it.
Does waiting for inducement improve results?
Slightly, in our test: 1H fair value gaps revisited after an inducement low was taken held 63% of the time, against 59% without. Only about a quarter of revisits had an inducement first, so the filter also reduces the number of trades.
Practical Exercise
Label 20 sequences.
Your task
Step 1: Find impulses
On 15-minute charts of one pair.
Step 2: Mark IDM and both order blocks
For each impulse.
Step 3: Record outcomes
Did the upper OB fail? Did price reach the extreme OB? Did it hold?
Step 4: Summarise
Count filled trades, unfilled setups and results in R.
Check Your Understanding
What makes a bullish correction valid in this model?
Related Lessons
Previous: Inducement and Fake Breakouts. Next module: Imbalances and Zones, starting with Market Imbalance and Displacement. See also How to Backtest a Trading Strategy.