
Fair Value Gap (FVG): Meaning, Identification and Examples
JustWolves is an educational platform and is not a SEBI-registered investment advisor. Trading financial instruments involves significant risk of loss and may not be suitable for all investors. Past performance is not indicative of future results. Read our full disclaimer →
What you'll learn
- A fair value gap (FVG) is the gap between the wicks of candle 1 and candle 3 in a strong three-candle move
- Bullish FVG: candle 3's low is above candle 1's high; bearish FVG: candle 3's high is below candle 1's low
- Traders watch three levels inside an FVG: the near edge, the 50% level (consequent encroachment) and the far edge
- An FVG that price has already traded through is 'mitigated' and usually no longer used
- FVGs are zones of interest, not guaranteed reaction points
In this article · 18 sections
The fair value gap is probably the most widely used SMC concept, and also the easiest to over-use: turn on an FVG indicator and the chart fills with rectangles. This lesson gives you a precise definition, shows how to mark FVGs correctly, explains the levels traders watch inside them, and sets realistic expectations about what happens when price returns.
What You Will Learn
- The three-candle definition of a fair value gap
- How to mark bullish and bearish FVGs
- The three levels inside an FVG and the BISI/SIBI terms
- How FVGs are used across timeframes
Before You Start
Read Market Imbalance and Displacement first.
The Three-Candle Rule
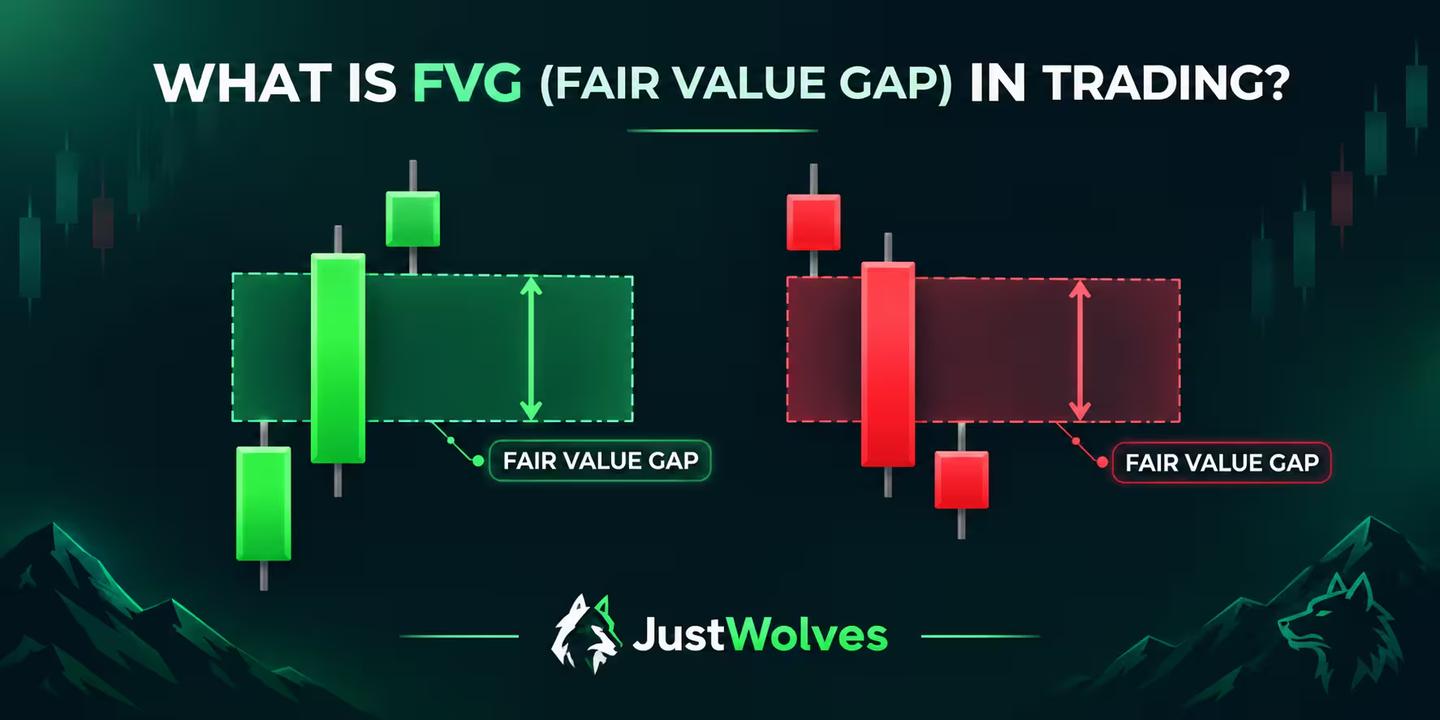
Look for three consecutive candles where the middle candle moves strongly in one direction. Then compare the wicks of candles 1 and 3.
A bullish FVG exists if candle 3's low is above candle 1's high: there's a gap between them that candle 2 passed through. A bearish FVG exists if candle 3's high is below candle 1's low. If the wicks of candles 1 and 3 overlap at all, there's no FVG.
Marking an FVG
On your chart
Step 1: Find a strong middle candle
A large-bodied candle in one direction.
Step 2: Check the outer wicks
Is there clear space between candle 1's wick and candle 3's wick?
Step 3: Draw the box
From candle 1's high to candle 3's low (bullish), or candle 1's low to candle 3's high (bearish).
Step 4: Extend it to the right
Until price trades back into it.
Step 5: Mark the 50% level
The midpoint of the box.
Try It on an Interactive Chart
Step through the chart below. The gap only becomes visible once candle 3 closes, because until then you cannot know where its low will be. That is why FVGs are always marked after the fact, and why a "gap" on a still-forming candle is not yet a gap.
Bullish FVG: find it, mark it, trade the return
Step 1 of 6
A quiet start
Three small, overlapping candles. Buyers and sellers are trading at the same prices, so there is no imbalance yet.
- What to observe
- Candle wicks overlap each other.
- Condition
- Nothing to mark.
Three Levels Inside an FVG
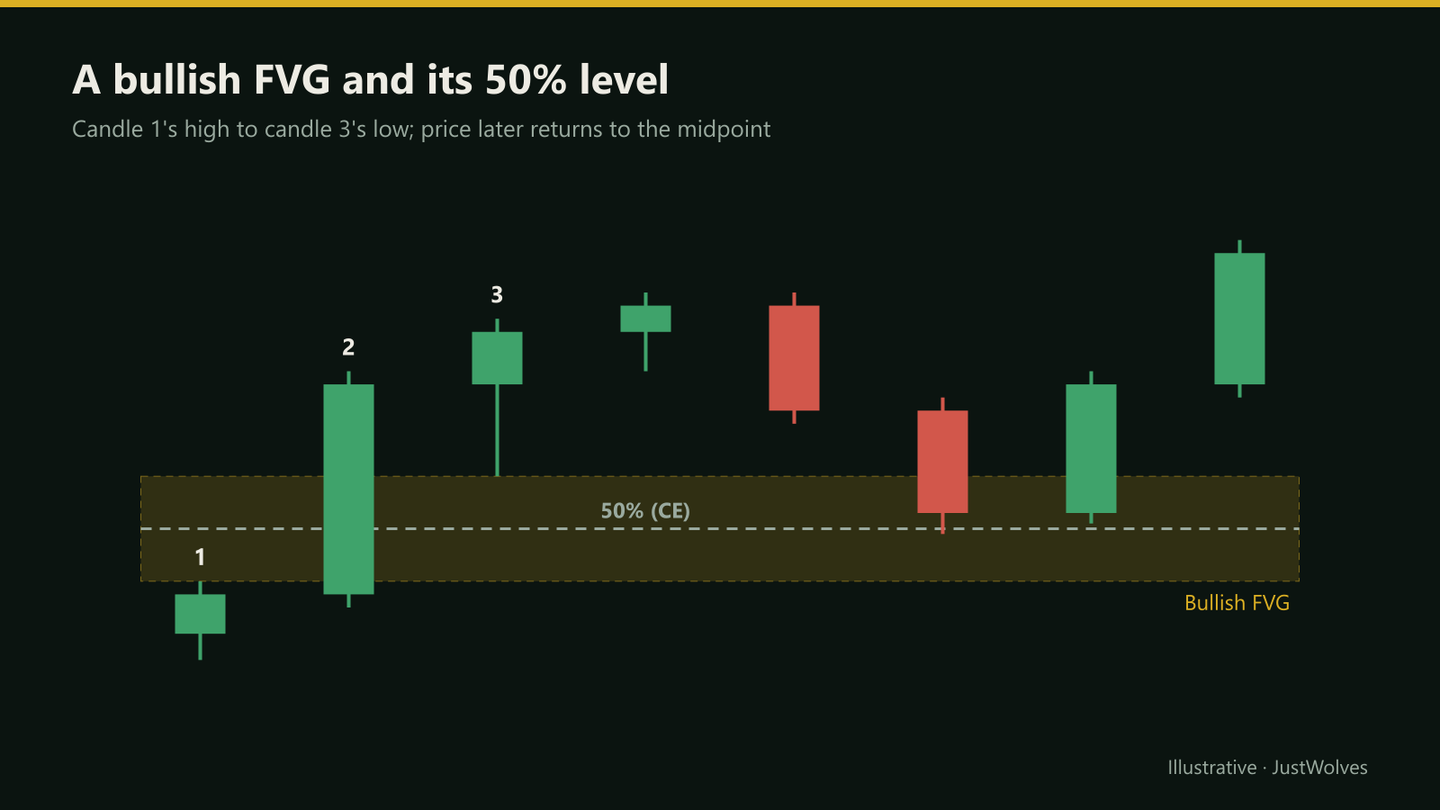
- Near edge: the side price reaches first (the top of a bullish FVG). Entries here have the smallest stop distance but fill on shallow pullbacks.
- 50% level, or consequent encroachment (CE): the midpoint. Many traders treat a close beyond the CE as a sign the gap is being absorbed.
- Far edge: the other boundary. A close beyond it usually means the FVG has failed.
BISI and SIBI
ICT-derived material uses two labels: BISI (buy-side imbalance, sell-side inefficiency) for a bullish FVG, where price rose with little selling in between, and SIBI (sell-side imbalance, buy-side inefficiency) for a bearish FVG. They describe the same three-candle gaps; you don't need them to use FVGs, but you'll see them in other material.
Reading a Bearish FVG
A bearish FVG (SIBI) is the same picture upside down. In a sharp fall, candle 3's high sits below candle 1's low. The gap runs from candle 3's high (its bottom) up to candle 1's low (its top). A pullback rises into it from below, so the near edge is candle 3's high, consequent encroachment is the midpoint, and the far edge is candle 1's low. Traders who sell into a bearish FVG place the stop above the far edge (and often above the displacement candle's high), and target the sell-side liquidity below recent lows.
One asymmetry is worth knowing. In stock indices, bearish FVGs created by news-driven sell-offs are often filled quickly by short covering. A bearish FVG in an index is therefore a weaker signal on its own than the same pattern in a steady downtrend.
Why Price Often Returns
The SMC explanation is that the fast move left orders unfilled, and that traders who missed the move place limit orders inside the gap hoping for a better entry. Both create interest at those prices.
The observable part is that price frequently retraces into recent FVGs. How often, and how it reacts there, varies by pair, timeframe and trend strength, which is why the next lesson adds filters.
Mitigation
An FVG that price has returned to and traded through is called mitigated. Most traders stop using it, or use only the part that hasn't been traded. If price trades into an FVG, reacts, and later returns again, the second reaction is generally treated as less reliable. Some traders also retire an FVG once a candle body closes beyond its 50% level, even if the far edge holds.
When a Gap Fails: Inversion
If a candle closes through the far edge of an FVG, the gap has failed. Some traders then flip its role: a failed bullish gap is watched as resistance on the next rally, and a failed bearish gap as support. ICT-derived material calls this an inversion fair value gap (IFVG). It is covered in detail in Inverse Fair Value Gap. For now, the practical rule is to stop treating a gap as support once a body has closed through it.
FVGs Across Timeframes
| Timeframe | Common use |
|---|---|
| Daily / 4-hour | Key zones and swing-trading targets |
| 1-hour / 15-minute | Primary intraday zones |
| 5-minute / 1-minute | Refining entries inside a higher-timeframe zone |
Practical Example
Hypothetically, a 1-hour GBP/USD rally leaves a bullish FVG between 1.2688 (candle 1's high) and 1.2702 (candle 3's low), with its 50% level at 1.2695.
Ajay places a buy limit at 1.2696, just above the 50% level, with a stop at 1.2683, below the far edge and a small buffer. His target is the recent high at 1.2741: 13 pips of risk for 45 pips of reward. If a 1-hour candle closes below 1.2688, he'll treat the FVG as failed.
Real Example: Gold, 9 October 2026
The worked example above is hypothetical. Here is the same idea on actual gold futures data. It shows something the schematic cannot: the decision of where inside the gap to enter matters a great deal.
Real bullish FVG: Gold 1H, 8–9 October 2026
Step 1 of 5
A slow climb
Through the evening of 8 October (UTC), gold edged higher in small overlapping candles.
- What to observe
- No gaps between candle wicks.
- Condition
- Nothing to mark.
Two observations from this chart are worth carrying into your own testing:
- The gap formed in a quiet session. The displacement candle printed at 01:00 UTC, during the Asian session, not at a London or New York open. Large moves outside the main sessions can still leave valid gaps, but liquidity is thinner then, so treat those gaps with a little more caution.
- The retest came at the New York pre-market. The return to the gap arrived at 08:00 New York time, shortly before the US session opened. The timing is a common pattern: price often revisits imbalances when a new session brings fresh orders.
Explore gold around the 9 October 2026 gap
Loading historical candles…
Choosing an Entry Level Inside the Gap
Every FVG gives you three candidate entry prices, and each is a trade-off between how often you get filled and how good the trade is when you do.
| Entry | Fill rate | Stop distance | Best suited to |
|---|---|---|---|
| Near edge | Highest | Widest | Strong trends, where retests are shallow |
| Consequent encroachment (50%) | Medium | Medium | Normal pullbacks; the most common default |
| Far edge | Lowest | Tightest | Ranging conditions; risks missing strong moves |
| Confirmation (lower-timeframe shift inside the gap) | Varies | Tight | Traders who can watch the screen at the time |
A useful habit when backtesting is to log how deep price went into every gap it returned to, as a percentage of the gap's height. After 50 gaps on one market and timeframe, you will have your own answer to "where should I enter?", rather than one borrowed from someone trading a different instrument.
The Psychology of Gaps
Fair value gaps are visually seductive. Once you start marking them, you see them everywhere, and every return to one feels like an opportunity. Two habits keep this in check. First, only mark gaps on the timeframe you actually trade and the one above it; gaps on lower timeframes are noise for your decisions. Second, decide in advance what makes a gap worth trading (trend direction, location in the range, size relative to recent candles) and write it down. The next lesson, Filtering High-Quality FVGs, gives you a checklist to start from.
Common Mistakes
- Marking gaps where the wicks overlap.
- Using bodies instead of wicks.
- Trading every FVG an indicator draws.
- Re-using mitigated FVGs.
- Ignoring the trend: counter-trend FVGs fail more readily.
Professional Insight
Experienced traders treat an FVG as a place to look, not a reason to act. The gap tells them where a pullback might pause; the decision to trade comes from trend, location and a confirmation signal. That's the role FVGs play in the setups in module 02.04.
Risk Considerations
- Price can slice through FVGs in strong moves.
- Tight stops inside small FVGs are easily hit by spreads and noise.
- News candles create large FVGs that behave unpredictably.
Important Terminology
| Term | Meaning |
|---|---|
| Fair value gap (FVG) | The gap between candle 1's and candle 3's wicks in a strong three-candle move. |
| Consequent encroachment (CE) | The 50% level of an FVG. |
| BISI | Buy-side imbalance, sell-side inefficiency: a bullish FVG. |
| SIBI | Sell-side imbalance, buy-side inefficiency: a bearish FVG. |
| Mitigated | Already traded back into and through. |
What is a fair value gap?
The gap between the wicks of the first and third candles in a strong three-candle move, where price moved quickly with little two-way trading.
How do I identify a bullish FVG?
Candle 3's low must be above candle 1's high, with a strong bullish candle 2 between them.
What is consequent encroachment?
The 50% level of a fair value gap, often watched for reactions.
Do fair value gaps always get filled?
No. Many gaps are revisited, but some are never filled, especially in strong trends, and how often price returns varies by market and timeframe. Treat the idea that "price always fills gaps" as a myth, and measure it on your own charts.
What does mitigated mean?
Price has already returned to and traded through the FVG, so most traders no longer use it.
What is the best entry inside an FVG?
There is no single best level. The near edge fills most often, the 50% level (CE) offers a better price, and the far edge gives the tightest stop but fills least. Test each on your market and pick one.
Is an FVG the same as a price gap on a stock chart?
No. A price gap is empty space between one candle's close and the next candle's open, often overnight. An FVG is defined across three candles, where candle 2 traded through prices that candles 1 and 3 never reached.
Practical Exercise
Mark FVGs by hand.
Your task
Step 1: Turn off indicators
On a 1-hour chart.
Step 2: Mark ten FVGs
Using the three-candle rule, with 50% levels.
Step 3: Check against an indicator
Did you miss any, or mark any with overlapping wicks?
Step 4: Track returns
Which were revisited, and where did price react?
Check Your Understanding
A bullish FVG requires:
Related Lessons
Previous: Market Imbalance and Displacement. Next: Filtering High-Quality FVGs. For inverse FVGs, see the ICT Trading course.