
When SMC Setups Fail: Limitations and Common Mistakes
JustWolves is an educational platform and is not a SEBI-registered investment advisor. Trading financial instruments involves significant risk of loss and may not be suitable for all investors. Past performance is not indicative of future results. Read our full disclaimer →
What you'll learn
- Every SMC setup can fail; losses are part of any method, not proof it's broken
- Main limitations: subjectivity, hindsight bias, unverifiable stories and selective examples
- Common failure causes: trading against the higher timeframe, entering without confirmation, poor stops, news
- Losing streaks are statistically normal: with a 40% win rate, a run of 8 losses in 100 trades is roughly a coin flip
- Judge SMC by your own written rules and tested results, not by screenshots
In this article · 16 sections
This course has tried to present Smart Money Concepts as a useful framework rather than a secret. This final lesson finishes that job. It looks squarely at why SMC setups fail, what the method's genuine limitations are, how normal losing streaks are even for sound strategies, and how to test SMC honestly before you trust it with money.
What You Will Learn
- The real limitations of the SMC framework
- The most common reasons individual setups fail
- Why losing streaks are normal, with the numbers
- How to test and review SMC honestly
Before You Start
Read SMC Trade Setups and Win Rate, Expectancy and Profit Factor first.
Limitations of the Framework
- Subjectivity: two traders can label the same swing, zone or sweep differently. Without written rules, results can't be compared or repeated.
- Hindsight bias: on a finished chart, the order block that held is obvious. In real time, there were three candidates and no way to know which would work.
- Unverifiable explanations: SMC's accounts of what institutions are doing can't be confirmed from a retail chart. A good story doesn't make a profitable rule.
- Selective examples: social media shows the setups that worked. You rarely see the ones that failed, which distorts expectations.
- Overlap with older ideas: many SMC concepts are classical price action renamed. That's fine, but a new name isn't a new edge.
What Our Tests Found Across This Course
Throughout the Smart Money Concepts course, JustWolves tested the main ideas on real market data, mostly six months of 1H candles for EUR/USD, GBP/USD, USD/JPY and gold. The table below summarises what those tests showed about how often SMC setups fail. Each result comes from a lesson in this course, where the rules and limits of the test are explained.
| Idea | What we found |
|---|---|
| Lower-timeframe shift (CHoCH or MSS) alone | Moved the right way less than half the time over 12 hours |
| Shift with the higher-timeframe trend | Clearly better than against it, but still close to a coin flip on direction |
| Full reversal setup (sweep, MSS, gap entry, 2R) | Positive on average; 63% winners with the 4H trend, 49% against it, small samples |
| Order block first revisit | Held about 60% of the time |
| Buying in deep premium | Among the weakest results we measured |
Two things follow. First, even the better setups lost a third to a half of the time. A loss is the expected outcome of many valid trades, not a sign that you applied the method wrongly. Second, the edge, where there was one, came from context: trend alignment, location and fixed reward-to-risk, rather than from any single pattern. That is the honest state of the evidence, and it is the reason this lesson focuses on surviving losses rather than avoiding them.
Why Individual Setups Fail
| Cause | What it looks like | Fix |
|---|---|---|
| Against the higher timeframe | A 5-minute CHoCH long in a 4-hour downtrend | Trade with the higher-timeframe bias, or wait for its CHoCH and BOS |
| No confirmation | Limit at every zone with no sweep or shift | Require the lower-timeframe trigger |
| Wrong location | Longs from premium | Discount for longs, premium for shorts |
| Poor stop | Stop at obvious liquidity or inside the zone | Beyond invalidation, with a buffer |
| News | Setup destroyed by a data release | Check the calendar; stand aside around high-impact events |
| Overtrading | Many marginal setups after a loss | Daily trade and loss limits |
A Valid Setup That Still Lost
Not every losing trade has a cause you can fix. The chart below shows a setup that met every written rule: bias, sweep, shift, gap, planned entry and stop. It still lost. Step through it and notice that the right response is to record the loss and change nothing.
A valid setup that still loses
Step 1 of 4
Sweep of the Asian low
With a bullish 4H bias, price drops below the Asian low at 1.2625, reaching 1.2615, and closes back above it.
- What to observe
- Sell-side liquidity taken in the direction of the bias.
- Condition
- Wait for a shift.
Real Case: A Valid Setup That Lost
The illustrative chart above shows the idea. The chart below shows it happening in a real market: GBP/USD on 17 September 2026, a setup that met every rule of the course's reversal model, came within 10 pips of its target, and was then stopped out by a single hourly candle.
Real case: a valid sweep-and-shift setup that lost, GBP/USD, 17 September 2026
Step 1 of 4
The sweep
After a sharp drop on the evening of 16 September, GBP/USD drifts lower. At 02:00 UTC it trades to 1.33699, just below the previous 24-hour low of 1.33708, and closes back above it. A sweep by the course's rules, though a very small one.
- What to observe
- Sell-side liquidity taken, barely.
- Condition
- Wait for a shift.
Losing Streaks Are Normal
Even a strategy with a positive expectancy loses often. With a 40% win rate, which is common for setups targeting 2R or more, long losing streaks are not just possible but likely over a reasonable sample. Assuming each trade is independent, here's the chance of seeing at least one losing streak of a given length in 100 trades:
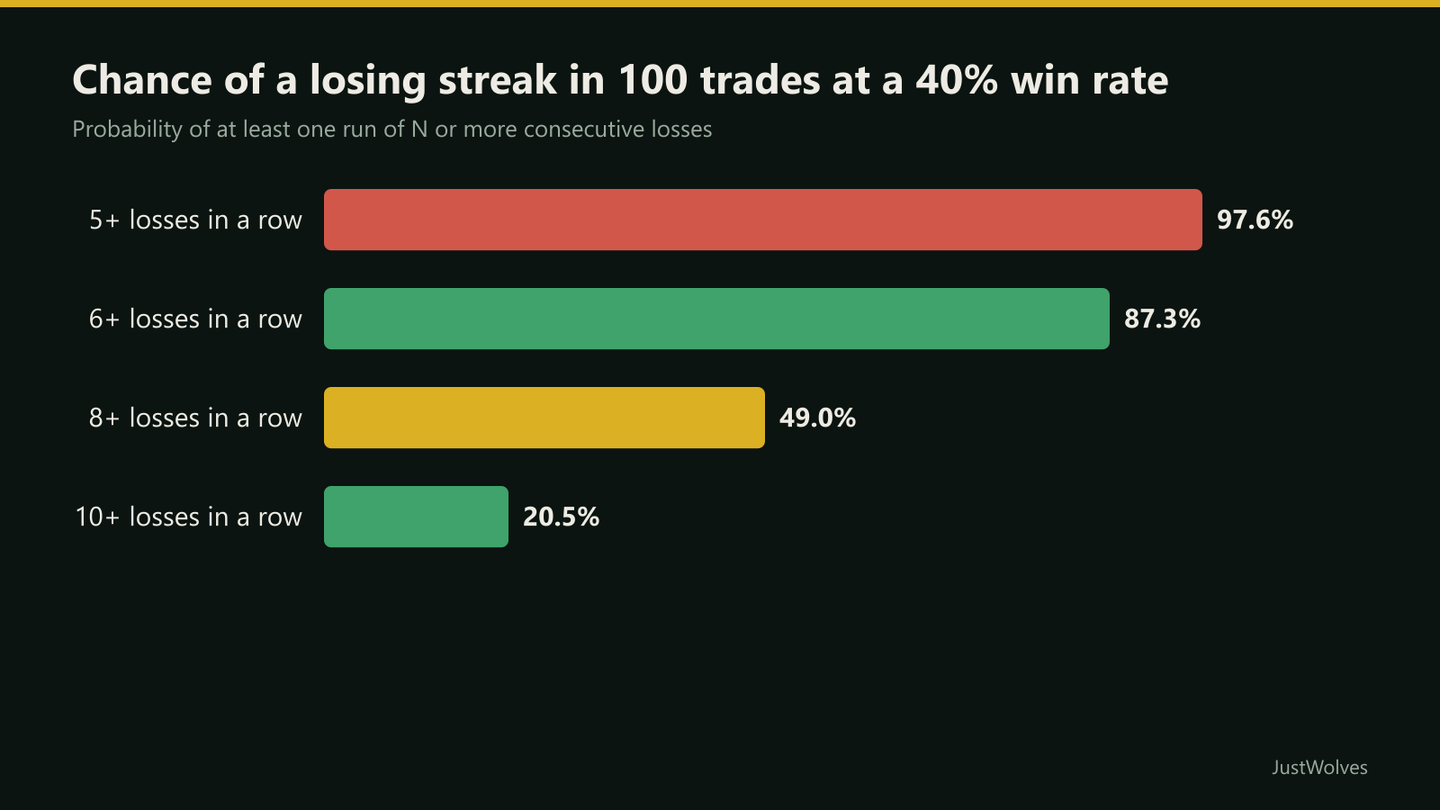
At 1% risk per trade, eight losses in a row is roughly an 8% drawdown. At 5% risk, it's about a third of the account. The streak isn't the problem; position size decides whether you survive it. See Maximum Drawdown.
How Long Can a Normal Losing Streak Be?
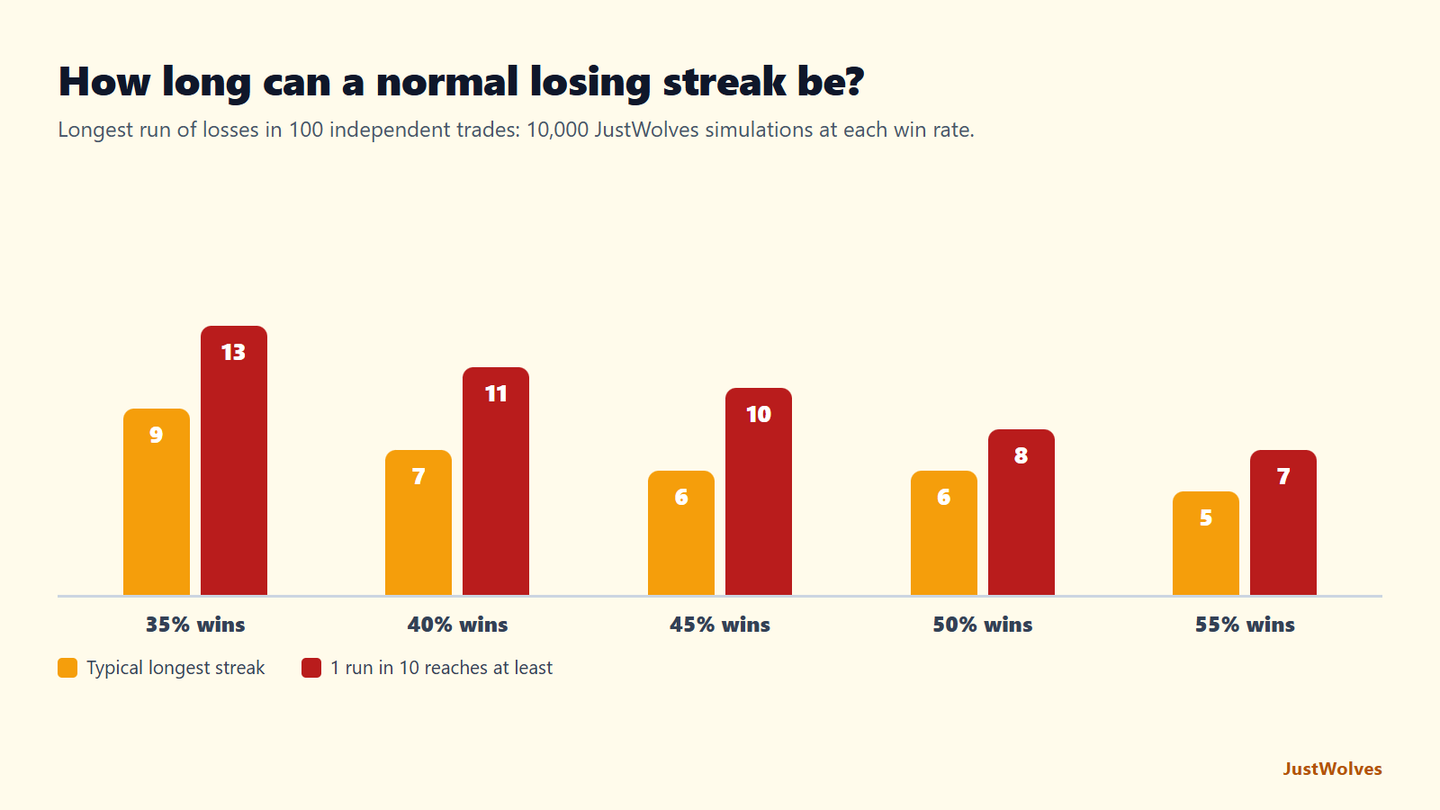
JustWolves simulated 10,000 runs of 100 independent trades at different win rates and recorded the longest losing streak in each run. The table shows the typical (median) longest streak and a bad but realistic case: the streak length that one run in ten reached or exceeded.
| Win rate | Typical longest streak | 1 run in 10: at least |
|---|---|---|
| 35% | 9 losses | 13 losses |
| 40% | 7 losses | 11 losses |
| 45% | 6 losses | 10 losses |
| 50% | 6 losses | 8 losses |
| 55% | 5 losses | 7 losses |
If your setups win 40% of the time, which is common for 2R targets, then seven losses in a row in 100 trades is ordinary, and eleven is unlucky but not unusual. Before you start trading a method, read your own row in this table and decide in advance that a streak of that length will not make you abandon the method.
| Risk per trade | 8 losses in a row | 11 losses in a row |
|---|---|---|
| 0.5% | 3.9% | 5.4% |
| 1% | 7.7% | 10.5% |
| 2% | 14.9% | 19.9% |
| 5% | 33.7% | 43.1% |
At 1% risk, even an unlucky eleven-loss streak costs about a tenth of the account, which is painful but recoverable. At 5% risk, the same streak removes over 40%, and you would need a gain of about 75% to get back to the start. The method is the same in both cases; only the position size differs.
Testing SMC Honestly
A fair test
Step 1: Write rules
Every definition: swings, sweeps, FVGs, OBs, triggers, entries, stops, targets.
Step 2: Backtest without hindsight
Scroll forward candle by candle; mark setups only with information available at the time.
Step 3: Record every setup
Including unfilled orders and setups you'd have skipped.
Step 4: Include costs
Spread, commission and slippage.
Step 5: Forward test
On demo or tiny size, then compare with the backtest.
How to Backtest a Trading Strategy covers the method in detail.
Reviewing Losing Trades
- Was it a valid setup that failed? Then it's a normal loss. Change nothing.
- Was it an invalid setup I took anyway? That's an execution error. Fix the process.
- Was the plan followed after entry? Moving stops or exiting early are errors even on winning trades.
- Is there a pattern over 20+ trades? Only then consider changing a rule.
Practical Example
Arnav trades a written SMC continuation setup at 1% risk. Over 40 trades, his journal shows a 42% win rate and an average win of 2.3R: an expectancy of (0.42 × 2.3) − (0.58 × 1) = +0.39R per trade, his own result rather than a general statistic.
In trades 41–48 he loses eight in a row. Reviewing them, seven were valid setups that failed; one was taken against the 4-hour bias, breaking his rules. He fixes the process error, keeps the rules unchanged and continues at the same 1% risk. His drawdown is about 8%, within the limits he planned for.
When Is a Rule Actually Broken?
A losing streak alone does not tell you whether a method has stopped working. Before you change a rule, check three things:
- Sample size: at least 30 to 50 trades under the same rules. Fewer than that, and normal variation can make a sound method look broken.
- Comparison with the test: is your win rate or average result outside the range your backtest suggested? A 40% method running at 35% over 40 trades is within normal variation; running at 15% over 60 trades is not.
- Execution: are the losses valid setups, or rule breaks? If half the losses are rule breaks, fix the execution before judging the rules.
If all three point to a real change, adjust one rule at a time and test it again. Changing several things at once makes it impossible to know which change helped.
Practise on a Real Chart
The chart below is real GBP/USD hourly data. Find ten sweep-and-shift setups using written rules, and log every one, including the ones that failed. Count how many reached 2R before the stop. Your result will very likely include a losing streak; compare its length with the table above.
Practice chart: GBP/USD hourly
Loading historical candles…
Common Mistakes
- Changing strategy after a few losses.
- Adding filters after every loss until no trades remain.
- Believing SMC can't fail if applied 'correctly'.
- Paying for signals or courses based on selected screenshots.
- Increasing size to recover a losing streak.
Professional Insight
Professional traders separate decision quality from outcome. A well-executed trade that loses is a good trade; a rule-breaking trade that wins is a bad one. Judging yourself on decisions, and the method on large samples, is what lets you stick with a sound approach through the losing streaks every approach has.
Risk Considerations
- Overconfidence in a method's story leads to oversizing.
- Small samples mislead in both directions.
- Market conditions change; review rules periodically, on evidence.
Important Terminology
| Term | Meaning |
|---|---|
| Hindsight bias | Seeing past outcomes as more predictable than they were. |
| Selection bias | Judging a method by examples chosen because they worked. |
| Losing streak | Consecutive losing trades. |
| Expectancy | Average result per trade, in R. |
| Execution error | A loss caused by breaking your own rules. |
Does Smart Money Concepts really work?
It's a framework, not a guarantee. Whether your specific SMC rules work can only be judged by testing them over many trades, including costs.
Why do my SMC trades keep failing?
Common causes are trading against the higher timeframe, entering without confirmation, poor location or stop placement, and news. Review each loss against your rules.
Is a losing streak a sign SMC doesn't work?
Not by itself. With a 40% win rate, a streak of eight losses in 100 trades happens about half the time. Judge the method on larger samples.
What are the limitations of SMC?
Subjective labelling, hindsight bias, unverifiable explanations about institutions, and selective examples in marketing.
How should I test SMC?
Write precise rules, backtest candle by candle without hindsight, record every setup including costs, then forward test on demo.
How long can a losing streak be with a 40% win rate?
In our simulation of 10,000 runs of 100 independent trades, the typical longest losing streak at a 40% win rate was 7 trades, and one run in ten had a streak of 11 or more.
Do SMC setups work?
Some parts showed an edge in our tests on real data, mainly with the higher-timeframe trend, at good locations and with fixed reward-to-risk. Even the better setups lost a third to a half of the time, and some ideas showed no edge at all. Test your own written rules before trusting them.
Do valid SMC setups lose even when every rule is followed?
Yes. In a real GBP/USD example from 17 September 2026, a sweep, a market structure shift with a fair value gap, and a limit entry all met the rules; price came within 10 pips of a 2R target and then fell 55 pips in an hour through the stop.
Practical Exercise
Audit your last 20 SMC trades or backtest setups.
Your task
Step 1: Classify each loss
Valid setup that failed, or execution error?
Step 2: Find the longest streak
And the drawdown it caused at your risk per trade.
Step 3: Calculate expectancy
In R, including costs.
Step 4: Decide
Process fixes only, or is there enough evidence to change a rule?
Check Your Understanding
Hindsight bias in SMC means:
Related Lessons
Previous: SMC Trade Setups. You've completed the Smart Money Concepts course; the ICT Trading course builds on these ideas. See also How to Backtest a Trading Strategy.