
Market Structure in SMC: Labelling Swings Step by Step
JustWolves is an educational platform and is not a SEBI-registered investment advisor. Trading financial instruments involves significant risk of loss and may not be suitable for all investors. Past performance is not indicative of future results. Read our full disclaimer →
What you'll learn
- Market structure is the sequence of swing highs and lows on a chart
- Bullish structure makes higher highs and higher lows; bearish makes lower highs and lower lows
- Use one consistent rule for what counts as a swing point
- Confirm breaks with candle closes, not wicks
- Structure is timeframe-specific; label each timeframe separately
In this article · 18 sections
Every other SMC concept, from breaks of structure to order blocks, depends on first labelling the market's swings correctly. If two traders label the same chart differently, they'll see different setups. This lesson gives you a clear, repeatable way to mark swing highs and lows and read the structure they form.
What You Will Learn
- What swing highs and swing lows are
- How to label HH, HL, LH and LL
- How to recognise bullish, bearish and ranging structure
- Rules that keep your labelling consistent
Before You Start
Read What Are Smart Money Concepts? first.
Swing Highs and Swing Lows
A swing high is a peak: a high with lower highs on either side. A swing low is a trough: a low with higher lows on either side. A common rule of thumb is a three-candle pattern, where the middle candle has the highest high (or lowest low) of the three, but on its own that produces many tiny swings.
To focus on meaningful swings, many traders require that a swing point leads to a clear move, for example one that breaks the previous opposite swing, or one that's visible without zooming in. Whichever rule you choose, write it down and apply it every time.
The Four Labels
| Label | Meaning |
|---|---|
| HH (higher high) | A swing high above the previous swing high |
| HL (higher low) | A swing low above the previous swing low |
| LH (lower high) | A swing high below the previous swing high |
| LL (lower low) | A swing low below the previous swing low |
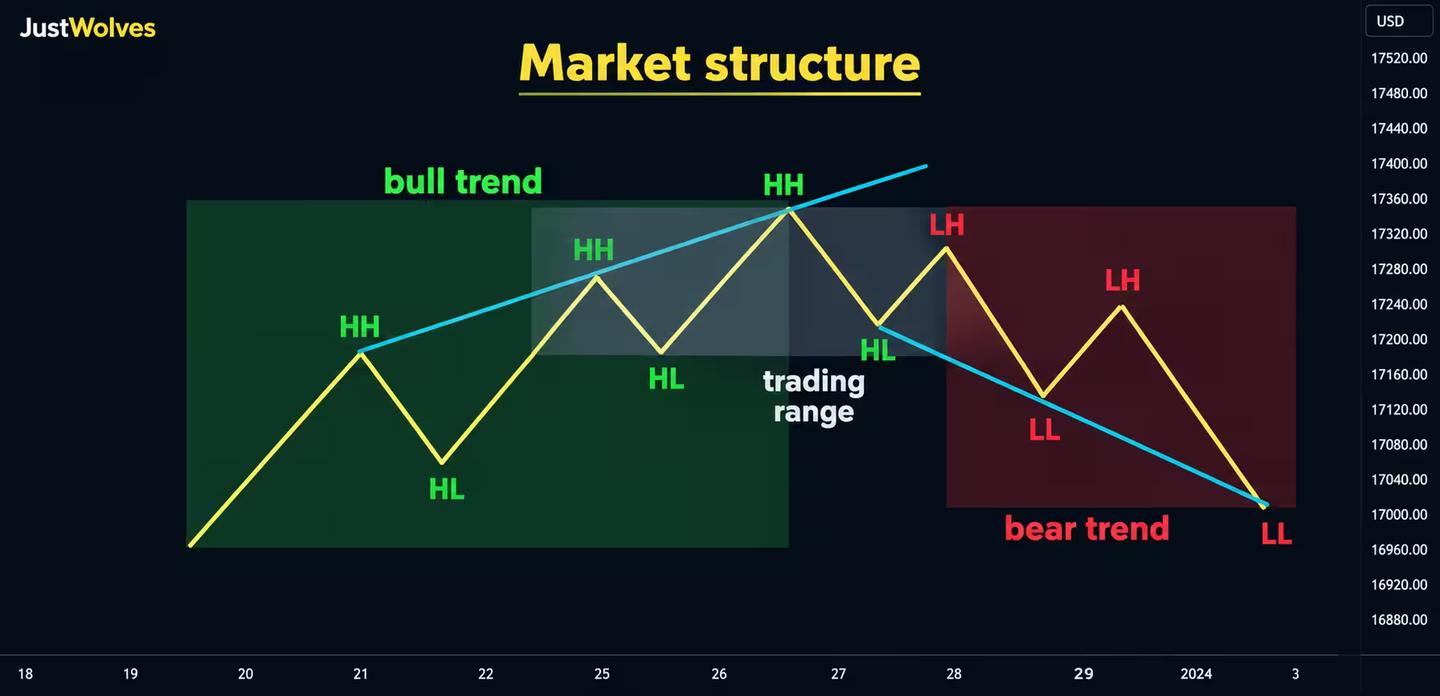
Label a Chart Step by Step
Step through the chart below. At each step, try to label the newest swing yourself before reading the explanation. Use the Annotations toggle to hide the labels.
Labelling HH, HL, LH and LL step by step
Step 1 of 5
The first swing
Price makes a high at 102.0 and pulls back to 100.8, above the starting low at 99.5. That pullback low is a potential higher low.
- What to observe
- A peak and a trough.
- Condition
- Only label swings you can clearly see.
Three Types of Structure
- Bullish: a sequence of higher highs and higher lows. Buyers are pushing price to new highs, and pullbacks hold above previous lows.
- Bearish: lower highs and lower lows. Rallies fail below previous highs and new lows keep forming.
- Ranging: highs and lows roughly level, with no consistent progression. Neither side is in control.
When Is a Swing Confirmed?
A swing low in an uptrend is usually only confirmed as a higher low once price goes on to make a new higher high. Until then, it's a potential low; price could still fall through it.
Similarly, a break of a swing high is confirmed by a candle close above it, not just a wick. A wick through a level that closes back below often signals a liquidity sweep (module 02.02) rather than a genuine break.
What Follows a Structure Break? Our Test
JustWolves measured what happens after structure breaks on about two years of real 4H candles for EUR/USD, GBP/USD, USD/JPY and gold. Swings: a high (or low) with two candles on each side that do not exceed it. Break: a candle close beyond the most recent confirmed swing. We labelled each break a BOS (in the direction of the current trend) or a CHoCH (against it), then recorded the direction of the next break.
| After a… | Cases | Next break in the same direction |
|---|---|---|
| Break of structure (BOS) | 606 | 51% |
| Change of character (CHoCH) | 516 | 57% |
The results are humbling for a popular assumption. After a BOS, the next break went the same way only about half the time; at this swing size, a BOS did not predict that the trend would continue. A CHoCH was a little more informative: in 57% of cases, the next break confirmed the new direction.
Two practical lessons follow. First, small swings, like the two-candle swings tested here, produce a lot of noise; the Internal vs External Structure lesson explains why traders focus on the larger swings. Second, structure is better used to organise a chart, deciding which levels matter and which direction to favour, than as a prediction on its own.
Practise labelling structure: GBP/USD 4H
Loading historical candles…
Structure Is Timeframe-Specific
A daily uptrend can contain a 1-hour downtrend: the 1-hour pullback is just one leg of the daily structure. Label each timeframe separately and keep them on separate notes. Lesson 02.01.03 explains how smaller swings inside a larger leg are treated as internal structure.
Step by Step: Labelling a Chart
A repeatable process
Step 1: Choose the timeframe
For example the 1-hour chart.
Step 2: Start from a clear extreme
Find an obvious swing high or low at the left of the chart.
Step 3: Mark the next opposite swing
Using your written rule for what counts as a swing.
Step 4: Label each new swing
Compare it with the previous swing of the same type: HH or LH, HL or LL.
Step 5: Read the sequence
Two or more HH and HL in a row: bullish. LH and LL: bearish. Mixed: ranging.
Practical Example
On a 1-hour GBP/USD chart, Aditi marks a swing low at 1.2600, a high at 1.2680, a low at 1.2640, then a high at 1.2710. The second high is above the first (HH) and the second low is above the first (HL): bullish structure.
Price then falls to 1.2655 and rallies to 1.2690, below 1.2710. That's a potential LH, but structure only turns bearish if price closes below the HL at 1.2640. Until then, she treats the market as bullish with a pullback in progress.
Choosing a Swing Size
Most structure confusion comes from not deciding what counts as a swing. Three common definitions, from most to fewest swings:
- One candle each side: any candle whose high is above the candles either side. Very sensitive; produces many swings and many false breaks.
- Two candles each side: the definition used in our test above. A reasonable default on the 1H and 4H charts.
- A minimum size: a swing only counts if the move into and out of it is at least one or two average candles. This removes most of the small wiggles that make structure noisy.
There is no correct choice, only a consistent one. Pick a definition, write it down, and use it on every chart you label, so that your BOS and CHoCH labels mean the same thing from one day to the next. If our 51% result for BOS on two-candle swings tells you anything, it is that small swings carry little information on their own.
The Psychology of Labelling
Labelling structure in hindsight is easy and satisfying; every chart looks orderly afterwards. Live, the most recent swing is always uncertain, because it is only confirmed later. Practise on the step-through chart above and in bar replay, where you only see closed candles, and resist relabelling past swings to fit what happened next.
Common Mistakes
- Marking every tiny wiggle as a swing.
- Changing the rule from chart to chart.
- Using wicks to confirm breaks.
- Mixing timeframes in one set of labels.
- Labelling in hindsight with information that wasn't available at the time.
Professional Insight
Experienced traders often say structure should be obvious. If you have to argue with yourself about whether a swing counts, it probably doesn't matter much. Clear structure on a higher timeframe is worth more than ambiguous structure on a lower one.
Risk Considerations
- Structure can change suddenly on news.
- Subjective labelling can make backtests unreliable; write precise rules.
- Ranges produce many false structure signals.
Important Terminology
| Term | Meaning |
|---|---|
| Swing high / low | A local peak or trough in price. |
| HH / HL | Higher high / higher low. |
| LH / LL | Lower high / lower low. |
| Bullish structure | A sequence of HH and HL. |
| Bearish structure | A sequence of LH and LL. |
| Candle close | The final price of a candle, used to confirm breaks. |
What is market structure in trading?
The pattern of swing highs and lows that shows whether a market is trending up, down or ranging.
What do HH, HL, LH and LL mean?
Higher high, higher low, lower high and lower low: labels comparing each swing with the previous one of the same type.
How do I identify a swing high?
A peak with lower highs on both sides. Use a consistent rule for how significant it must be.
Should I use wicks or closes for structure?
Closes for confirming breaks. Wicks show where price traded but often reverse.
Which timeframe should I use for structure?
Label several, separately: a higher timeframe for direction and a lower one for entries.
Does a break of structure mean the trend will continue?
Not reliably on small swings. In our test on two years of real 4H data across four markets, the next structure break after a BOS went in the same direction only 51% of the time.
How reliable is a change of character?
Somewhat. In our 4H test, 57% of CHoCHs were followed by a structure break in the new direction, while 43% turned back. Treat a CHoCH as a warning that needs confirmation.
Practical Exercise
Label structure on three charts.
Your task
Step 1: Write your swing rule
In one sentence.
Step 2: Label three charts
EUR/USD daily, 4-hour and 1-hour, covering the same period.
Step 3: Classify each
Bullish, bearish or ranging.
Step 4: Compare
Note where the timeframes agree and disagree.
Check Your Understanding
A swing high above the previous swing high is a:
Related Lessons
Previous: What Are Smart Money Concepts?. Next: Internal vs External Structure. See also the Price Action course.