
What Is Breakout Trading?
JustWolves is an educational platform and is not a SEBI-registered investment advisor. Trading financial instruments involves significant risk of loss and may not be suitable for all investors. Past performance is not indicative of future results. Read our full disclaimer →
What you'll learn
- A breakout is price moving decisively beyond a level or range it has previously respected
- Breakouts happen when orders on one side overwhelm the other: stops trigger, new traders enter and short sellers cover
- Many breakouts fail and fall back into the range, so confirmation and risk control matter as much as the entry
- The main types are level, trendline, range and pattern breakouts, plus intraday ones such as the opening range
- A complete breakout plan defines the level, the confirmation, the entry, the stop and what happens if the breakout fails
In this article · 16 sections
Breakout trading is built on a simple observation: when price escapes a level or range it has respected for some time, it often travels some distance before the next pause. Buying as resistance gives way, or selling as support breaks, aims to catch that move early. The catch is that many breakouts fail. This lesson explains why breakouts happen, the main types, why they fail, and what a breakout trader needs before taking one.
What You Will Learn
- What a breakout is and why it happens
- The main types of breakout
- Why many breakouts fail
- The parts of a complete breakout plan
Before You Start
This course assumes you can identify support, resistance and ranges. Read What Is Support and Resistance? A Beginner's Guide and Consolidation and Trading Ranges first.
What Is a Breakout?
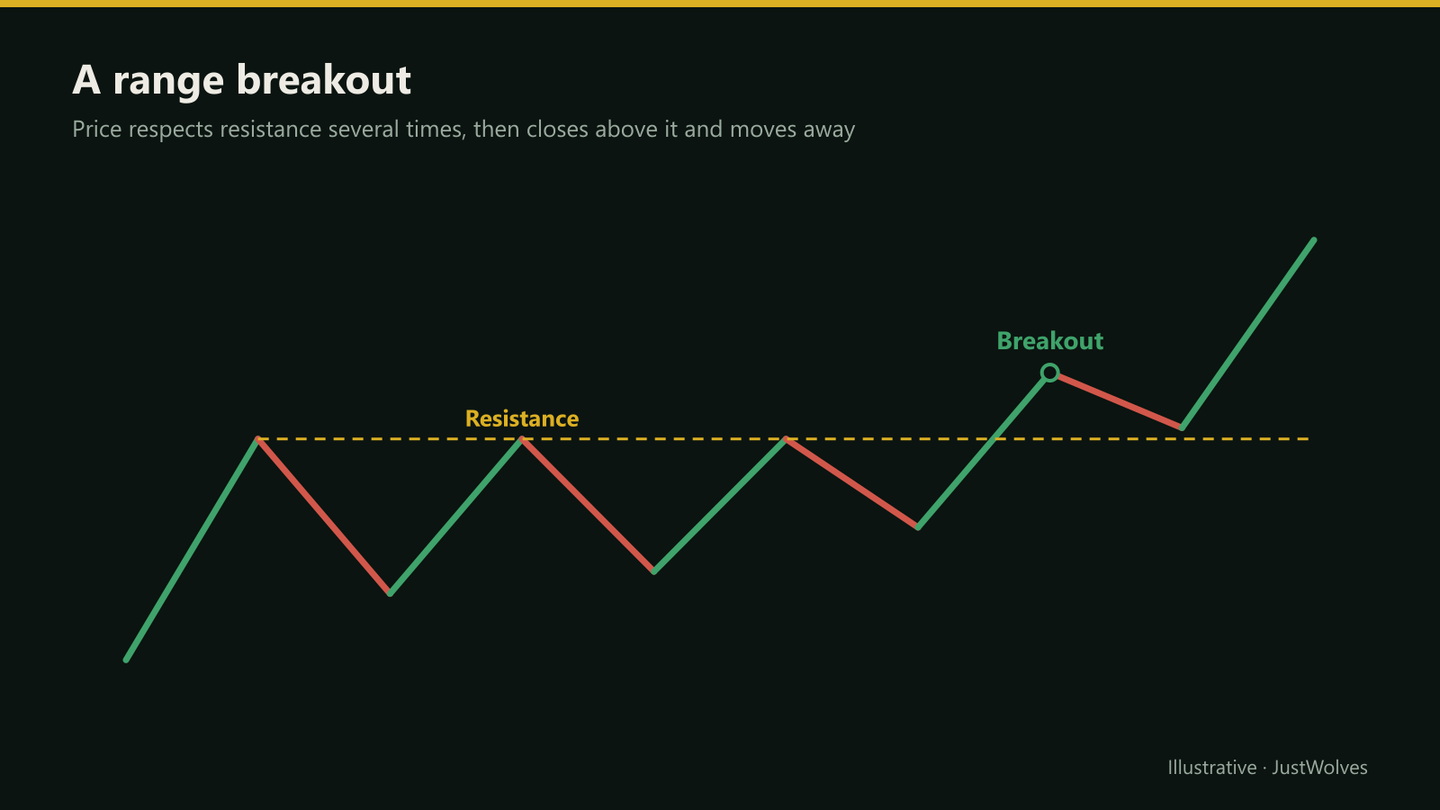
A breakout is a move beyond a price level or range that has capped or supported price before. An upside breakout moves above resistance; a downside breakout, often called a breakdown, moves below support.
The word 'decisively' matters. Price poking a few rupees above a level during the session and closing back below it isn't usually counted as a breakout. Most breakout traders want a close beyond the level, often with above-average volume, before treating it as real.
Why Breakouts Happen
A level that has held several times collects orders around it. Above resistance sit buy-stop orders from short sellers protecting their positions and from breakout traders waiting to enter. When price trades through the level, those orders trigger together, adding buying pressure just as the sellers who defended the level are exhausted.
That's why a genuine breakout often moves quickly at first. It also explains why breakouts fail: if the burst of triggered orders isn't followed by real, continuing demand, price can fall back into the range once the stops have been filled.
Main Types of Breakout
| Type | What breaks | Lesson |
|---|---|---|
| Support and resistance | A horizontal level | 10.01.02 |
| Trendline | A sloping line connecting highs or lows | 10.01.03 |
| Range | The boundary of a sideways consolidation | 10.01.04 |
| Chart pattern | The boundary of a triangle, flag or pennant | 10.03.04 |
| Opening range | The high or low of the first minutes of the session | 10.03.02 |
| Previous day or week | The prior period's high or low | 10.03.03 |
Why Many Breakouts Fail
- The level was weak: few prior touches or a loose, wide range.
- No real demand: price triggered stops but buyers didn't follow through.
- Against the bigger trend: an upside breakout into a weekly downtrend or overhead resistance.
- Poor timing: breakouts late in an extended move, or in a falling broad market.
- Deliberate traps: large players pushing price through a level to fill orders on the other side.
Real Prices: A Breakout That Failed
Kiran's example in this lesson is a breakout that works. The chart below shows the more common outcome in our data, on real Reliance prices from June and July 2025: a close above a fresh high on ordinary volume, a quick return below the level, and a stop that limited the damage.
Real prices: a breakout without volume that failed, Reliance, June–July 2025
Step 1 of 4
A strong run to a high
In June 2025 Reliance rallies from about ₹1,430 to a high of ₹1,524.8 on 30 June, the highest price in three months. The level is fresh: touched once, not tested several times.
- What to observe
- A breakout after an extended move, not from a tight base.
- Condition
- This lesson's failure list: late in a move, weak level.
The Parts of a Breakout Plan
Before the breakout
Step 1: Define the level
A clear level with several touches, ideally after a tightening range.
Step 2: Define confirmation
A close beyond the level, volume above average, or both.
Step 3: Define the entry
On the breakout close, on a break of that candle's high, or on a retest of the level.
Step 4: Define the stop
Back inside the range, beyond where the breakout would be clearly failed.
Step 5: Define the target
A measured move, the next resistance, or a trailing stop.
Breakouts in Indian Markets
Breakout trading is applied to cash-market stocks on daily and weekly charts, to Nifty and Bank Nifty futures and options intraday, and to sector indices. Intraday breakouts around the opening range and previous-day levels are popular in index derivatives, while multi-week base breakouts are more common in swing and positional stock trading.
Stock-specific price bands can limit how far a stock moves in one session, and breakouts around results or major announcements can gap rather than move smoothly through the level. Both affect entries and stops.
Practical Example
Hypothetically, a stock has traded between ₹780 and ₹840 for nine weeks, with each dip shallower than the last. Kiran marks ₹840 as resistance. One day, the stock closes at ₹852 on volume about twice its 20-day average.
Kiran buys at ₹854 the next morning, with a stop at ₹826, back inside the range. The range height is ₹60, so his measured-move target is ₹900. Risk is ₹28 a share and the potential reward is ₹46, about 1.6R. Two weeks later the stock reaches ₹902.
How Often Do Breakouts Follow Through? Our Test
JustWolves measured breakouts on about two years of daily prices for 17 large NSE stocks (November 2024 to November 2026). A breakout: a close above the highest high of the previous 20 or 50 trading days. For each, we checked whether price closed back below the level within five days (this lesson's definition of failure), whether it was higher 10 days later, and whether it reached the measured move, the range's height added to the level, within 20 days. We split the results by breakout-day volume: above or below 1.5 times the 20-day average.
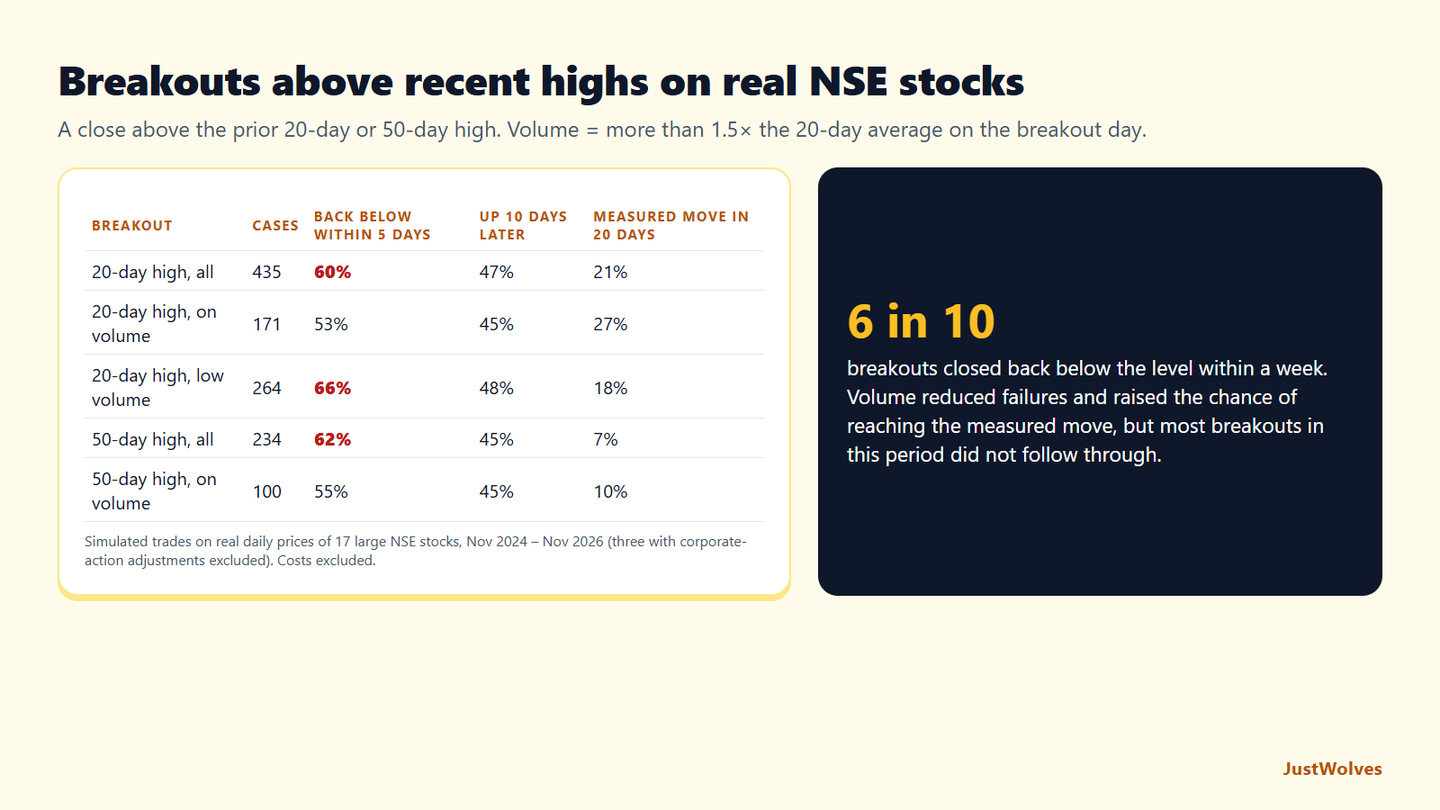
| Breakout | Cases | Back below the level within 5 days | Higher 10 days later | Measured move within 20 days |
|---|---|---|---|---|
| 20-day high, all | 435 | 60% | 47% | 21% |
| 20-day high, volume above 1.5× | 171 | 53% | 45% | 27% |
| 20-day high, lower volume | 264 | 66% | 48% | 18% |
| 50-day high, all | 234 | 62% | 45% | 7% |
| 50-day high, volume above 1.5× | 100 | 55% | 45% | 10% |
Most breakouts failed in this period. About six in ten closed back below the level within a week, and fewer than half were higher 10 days later. That is this lesson's warning about failures, measured: a breakout trade is not complete without an exit for when price falls back into the range, as in the Reliance chart above.
Volume helped, but only somewhat. Breakouts on more than 1.5 times average volume failed less often (53% against 66% for 20-day breakouts) and reached the measured move more often (27% against 18%). That supports this lesson's preference for above-average volume as confirmation, without making it a guarantee.
The measured move was ambitious. Only about a fifth of 20-day breakouts, and fewer than one in ten 50-day breakouts, reached it within a month. Treat it as an outer target and look first for the nearest resistance, as the next lesson suggests.
These results come from mechanical rules in a period with two sharp falls. The selective approach in this lesson's professional insight, a clean level, a tightening range and a supportive trend, is meant to filter out many of these failures; the following lessons test some of those filters.
Common Mistakes
- Buying intraday pokes above a level without a close.
- Trading breakouts from loose, wide ranges.
- Ignoring the higher-timeframe trend.
- No plan for failure.
- Chasing breakouts that have already moved far from the level.
Professional Insight
Experienced breakout traders tend to be very selective about the setup before the breakout: a clean level, a tightening range and a supportive trend. Many say most of the work happens before the level breaks, and that the breakout itself only confirms what the preparation suggested.
Risk Considerations
- False breakouts are common.
- Gaps through the level can make entries and stops worse.
- Momentum reversals can be fast once a breakout fails.
Important Terminology
| Term | Meaning |
|---|---|
| Breakout | A decisive move beyond a level or range. |
| Breakdown | A downside breakout below support. |
| False breakout | A breakout that quickly returns inside the range. |
| Measured move | A target based on the height of the range or pattern. |
| Follow-through | Continued movement in the breakout direction. |
What is breakout trading?
Entering a trade as price moves decisively beyond a support, resistance or range boundary, aiming to catch the move that follows.
Is breakout trading profitable?
It can be for disciplined traders, but many breakouts fail, so results depend on selective setups, confirmation and tight risk control.
What confirms a breakout?
Commonly a close beyond the level and above-average volume; some traders also wait for a retest.
Why do breakouts fail?
Weak levels, no follow-through demand, trading against the bigger trend, poor timing and deliberate traps.
Where should the stop go on a breakout trade?
Back inside the range, at the point where the breakout would clearly have failed.
How many breakouts fail?
Many. In our test on 17 large NSE stocks over two years, about 60% of closes above the prior 20-day high closed back below that level within five trading days. With volume above 1.5 times average, the failure rate was lower, about 53%.
Does volume confirm a breakout?
It helps somewhat. In our NSE data, 20-day breakouts on more than 1.5 times average volume failed less often (53% vs 66%) and reached their measured move more often (27% vs 18%) than low-volume breakouts.
Practical Exercise
Find breakouts.
Your task
Step 1: Scan ten daily charts
Look for ranges of at least four weeks.
Step 2: Mark the levels
Count the touches on each boundary.
Step 3: Find past breakouts
Note which followed through and which failed.
Step 4: Compare
What did the successful ones have in common?
Check Your Understanding
A breakout is:
Related Lessons
Next: Support and Resistance Breakouts. See also Consolidation and Trading Ranges and The Three Core Swing Setups.