
Volume Confirmation
JustWolves is an educational platform and is not a SEBI-registered investment advisor. Trading financial instruments involves significant risk of loss and may not be suitable for all investors. Past performance is not indicative of future results. Read our full disclaimer →
What you'll learn
- Volume shows participation: a breakout on heavy volume has more traders behind it
- Compare breakout volume with the recent average; many traders look for 1.5 to 2 times or more
- Quiet volume inside the base and a volume surge on the break is the classic pattern
- Intraday, compare volume with the same time of day, not the full-day average
- Volume improves the odds; it doesn't guarantee a breakout will hold
In this article · 15 sections
Price tells you a level has broken; volume tells you how many traders took part. A breakout on twice the usual volume suggests real demand is driving the move, while one on below-average volume may be just a few orders pushing through a thin market. This lesson covers how to measure breakout volume, the volume pattern to look for before and during a breakout, India-specific data such as delivery percentage, and where volume can mislead.
What You Will Learn
- Why volume matters at breakouts
- How to measure relative volume
- The volume pattern in a good base
- Intraday volume and delivery data
Before You Start
Why Volume Matters
A breakout needs buyers willing to keep paying higher prices after the stop orders above the level have been filled. Heavy volume on the breakout day suggests many participants, often including larger institutions whose buying takes days or weeks to complete. That continuing demand is what produces follow-through.
A breakout on light volume can still work, but it has less evidence behind it. If the move was driven by a handful of stop orders, there may be no one left to buy once they're filled.
Relative Volume
Relative volume compares the breakout day's volume with a recent average, usually the 20 or 50-day average. A stock that normally trades 4 lakh shares a day and trades 9 lakh on the breakout day has relative volume of 2.25.
Many breakout traders look for at least 1.5 times, and prefer 2 times or more. These are guidelines rather than thresholds with research behind a specific number; the point is that the breakout day should stand out clearly from the base.
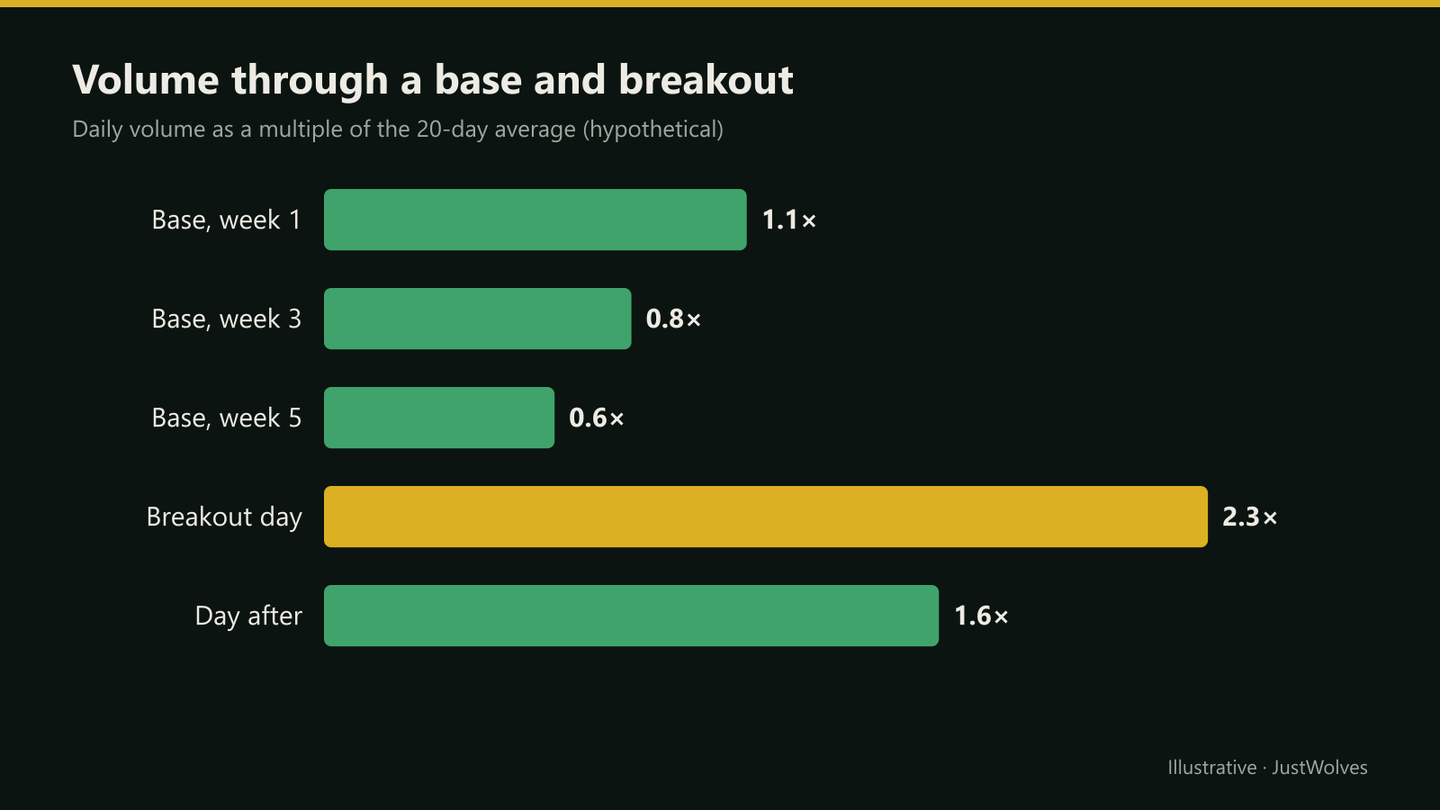
The Volume Pattern in a Good Base
- Volume dries up as the base tightens: fewer sellers are left.
- Up days inside the base tend to have more volume than down days.
- The breakout day stands out clearly from the base's volume.
- Follow-through days keep above-average volume as price moves away from the level.
Heavy-volume down days inside the base, especially near the lows, are a warning that sellers are still active and the base may not be ready.
Real Prices: Quiet Base, Loud Breakout
The volume chart above is hypothetical. The chart below shows the same pattern on real Hindustan Unilever prices from April 2026: quiet volume in the base, a clear surge on the breakout day, and continued interest as price moved away from the level.
Real prices: a base breakout on 2.2× volume, Hindustan Unilever, April 2026
Step 1 of 4
A quiet base
After a fall into late March 2026, Hindustan Unilever builds a base between about ₹2,022 and ₹2,193, the high of 8 April. In mid-April the stock drifts sideways near ₹2,130–2,160 on 0.7 to 1.0 times average volume.
- What to observe
- Volume quietening inside the base, as this lesson's pattern describes.
- Condition
- Level to watch: ₹2,192.8.
Intraday Volume
Volume isn't spread evenly through the session. In Indian markets, it's usually highest in the first hour after 9:15 am and in the last hour before 3:30 pm, and quieter around midday. Comparing a 10 am breakout's volume with the full-day average understates it; comparing a 3 pm candle with a midday average overstates it.
For intraday breakouts, compare volume with the same time of day over recent sessions, or with the average volume of the same candle interval. Many charting platforms offer a relative-volume-at-time indicator for this.
Delivery Data and Index Breakouts
For NSE cash-market stocks, the exchange publishes the quantity delivered each day as a share of traded volume. A breakout with a high delivery percentage suggests more buyers took delivery rather than trading intraday, which some traders read as stronger conviction. It's a supplementary signal: delivery data is published after the close and varies widely between stocks.
Indices themselves have no volume. For Nifty or Bank Nifty breakouts, traders use the volume of the index futures, or the combined volume of the index's largest constituents, as a proxy.
Practical Example
Hypothetically, a stock trades an average of 4 lakh shares a day. Through a six-week base below ₹720, volume falls to about 2.5 lakh a day. On the breakout day, it closes at ₹731 on 9.2 lakh shares, about 2.3 times its 20-day average, and the delivery percentage is higher than its recent norm.
Arvind buys at ₹733 with a stop at ₹709, risking ₹24. The next day volume stays above average at 6.4 lakh, and price holds above ₹720. He keeps the trade. A similar breakout in another stock the same week, on volume of just 1.1 times average, closes back inside its range two days later.
How Much Volume Is Enough? Our Test
This lesson says 1.5 times average volume is a common threshold but not one with research behind a specific number. JustWolves measured it on about two years of daily prices for 17 large NSE stocks (November 2024 to November 2026): 419 closes above the prior 20-day high, split by relative volume on the breakout day. We also compared bases where volume had dried up (the last 10 days below 0.8 times the 50-day average) with those where it had not.
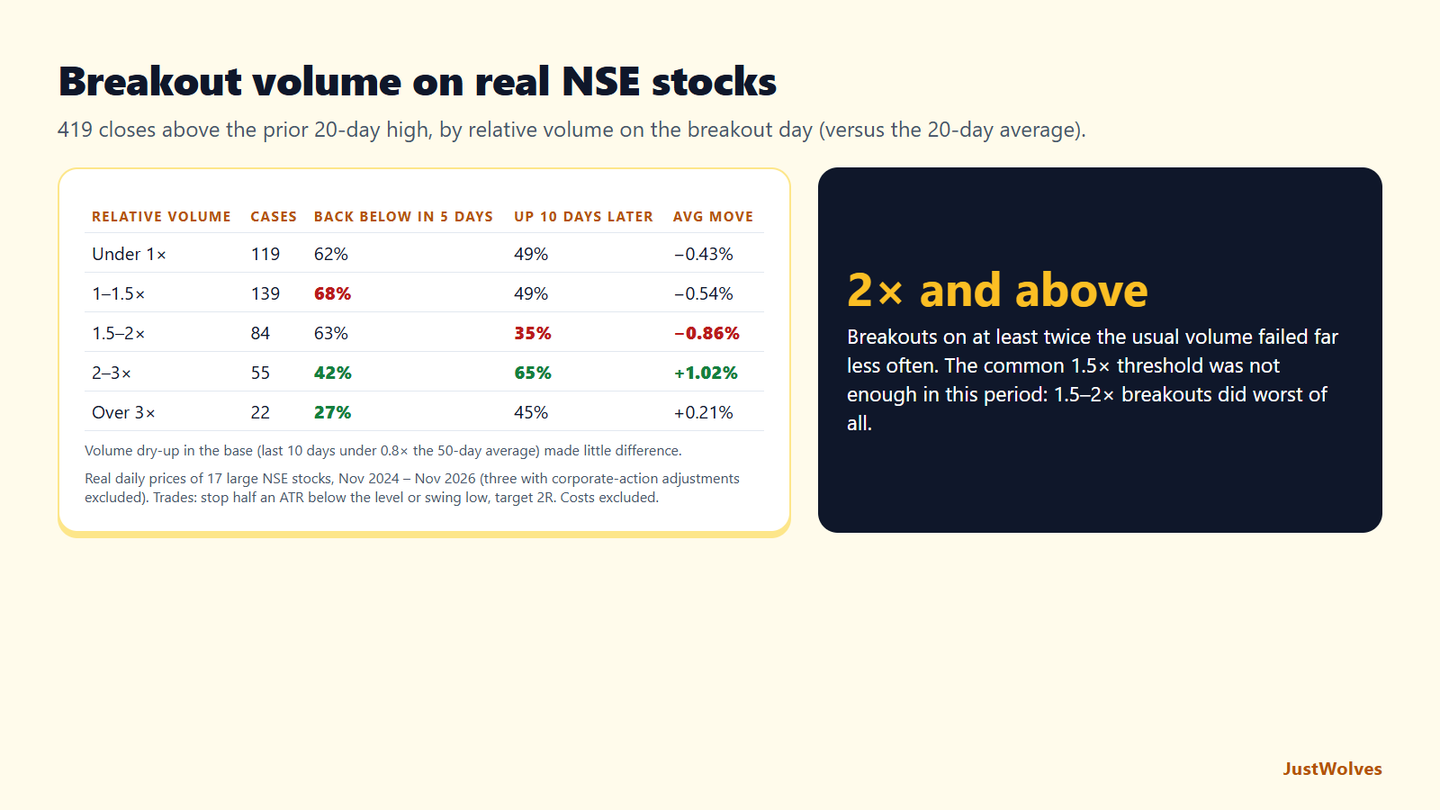
| Relative volume | Cases | Back below within 5 days | Up 10 days later | Average 10-day move |
|---|---|---|---|---|
| Under 1× | 119 | 62% | 49% | −0.43% |
| 1–1.5× | 139 | 68% | 49% | −0.54% |
| 1.5–2× | 84 | 63% | 35% | −0.86% |
| 2–3× | 55 | 42% | 65% | +1.02% |
| Over 3× | 22 | 27% | 45% | +0.21% |
| Base | Cases | Back below within 5 days | Up 10 days later |
|---|---|---|---|
| Volume dried up (last 10 days under 0.8× the 50-day average) | 95 | 62% | 49% |
| No dry-up | 324 | 59% | 48% |
The threshold that mattered was about 2 times, not 1.5. Breakouts on 2–3 times average volume failed within a week only 42% of the time and were higher 10 days later 65% of the time, the best group in our breakout tests. Above 3 times, failures fell to 27%. But breakouts on 1.5–2 times volume, which pass the common rule of thumb, did no better than low-volume ones, and were the weakest group for the 10-day move.
Volume dry-up in the base, measured mechanically, made little difference here. This lesson's professional insight values a base where volume steadily dries up before a clear surge; our simple 10-day versus 50-day measure did not capture an advantage. It may need a better definition, or simply more data.
The practical reading supports this lesson's callout: check what caused a volume spike, and prefer breakouts that stand out clearly, at around twice the usual volume or more, rather than ones that only just clear a threshold.
Common Mistakes
- Ignoring volume entirely.
- Treating any spike as confirmation without checking the cause.
- Comparing intraday volume with full-day averages.
- Assuming high volume guarantees success.
- Looking for index volume instead of futures volume.
Professional Insight
Many experienced breakout traders pay as much attention to volume during the base as on the breakout day. A base where volume steadily dries up, followed by a clear surge, tells a consistent story: sellers left, then buyers arrived. When the story is inconsistent, such as heavy selling inside the base or a quiet breakout, they reduce size or skip the trade.
Risk Considerations
- High-volume breakouts can still fail.
- Event-driven spikes can mislead.
- Thinly traded stocks have unreliable volume and wide spreads.
Important Terminology
| Term | Meaning |
|---|---|
| Relative volume | Volume compared with a recent average. |
| Volume dry-up | Shrinking volume as a base tightens. |
| Delivery percentage | Share of traded quantity that was delivered, published by NSE. |
| Follow-through | Continued movement and interest after the breakout. |
| Block deal | A single large trade, often between institutions. |
How much volume confirms a breakout?
Many traders look for at least 1.5 times the 20 or 50-day average volume, and prefer 2 times or more.
Can a breakout work on low volume?
Yes, but it has less evidence behind it, and low-volume breakouts fail more often in many traders' experience.
What is relative volume?
The current volume divided by a recent average volume.
What is delivery percentage?
The share of a stock's traded quantity that was delivered rather than squared off intraday, published daily by NSE.
How do I check volume for Nifty breakouts?
Use Nifty futures volume, since the index itself has no volume.
What relative volume confirms a breakout?
In our test on 17 NSE stocks, about 2 times the 20-day average or more. Breakouts on 2–3 times volume failed within five days 42% of the time, against 63% for 1.5–2 times. The often-quoted 1.5 times threshold did not help in this period.
Does volume drying up in the base help a breakout?
Not measurably in our simple test. Breakouts after bases where the last 10 days' volume was below 0.8 times the 50-day average failed about as often (62%) as others (59%). A clear surge on the breakout day mattered more.
Practical Exercise
Study breakout volume.
Your task
Step 1: Find 20 past breakouts
On daily charts.
Step 2: Record relative volume
On the breakout day.
Step 3: Record outcomes
Did each follow through or fail within ten days?
Step 4: Compare
Did higher relative volume breakouts follow through more often?
Check Your Understanding
Average volume 4 lakh; breakout day 9 lakh. Relative volume:
Related Lessons
Previous module: Volatility Contraction Before Breakouts. Next: Reading the Breakout Candle. See also Volume Analysis.