
Breakout and Retest
JustWolves is an educational platform and is not a SEBI-registered investment advisor. Trading financial instruments involves significant risk of loss and may not be suitable for all investors. Past performance is not indicative of future results. Read our full disclaimer →
What you'll learn
- A retest is a return to the broken level after a breakout; old resistance often acts as support
- Retest entries give closer stops and better reward-to-risk than buying the breakout
- A healthy retest is orderly, on lighter volume, and holds above the level on a closing basis
- A close back inside the range turns the retest into a failed breakout
- Strong breakouts often don't retest, so retest traders accept missing some moves
In this article · 16 sections
Buying the breakout itself means entering when price is furthest from the level and the stop is widest. Many traders prefer to wait for price to come back to the broken level, check that it now holds as support, and enter there. The breakout and retest is one of the most widely taught breakout strategies. This lesson covers why retests happen, how to tell a healthy retest from a failing one, and the trade-off of waiting.
What You Will Learn
- Why retests happen
- What a healthy retest looks like
- Entry triggers and stops on retests
- When retests fail, and when to skip the wait
Before You Start
Why Retests Happen
After a breakout, early buyers take quick profits and some traders who sold at the level try again. Price drifts back toward the level. If demand is real, buyers who missed the breakout step in near the level, and traders who were short there buy to close. The old resistance holds as support, an example of role reversal.
Not every breakout retests. Strong breakouts driven by heavy institutional demand can run without looking back. Weaker ones may retest several times.
Healthy vs Failing Retests
| Feature | Healthy retest | Failing retest |
|---|---|---|
| Speed | Orderly drift back | Sharp fall back through the level |
| Volume | Lighter than the breakout | Heavy selling |
| Closes | Hold at or above the level | Close back inside the range |
| Candles at the level | Rejection wicks, bullish reversal candles | Large bearish bodies |
| Depth | Reaches the level zone, maybe slightly inside intraday | Moves well back inside the range |
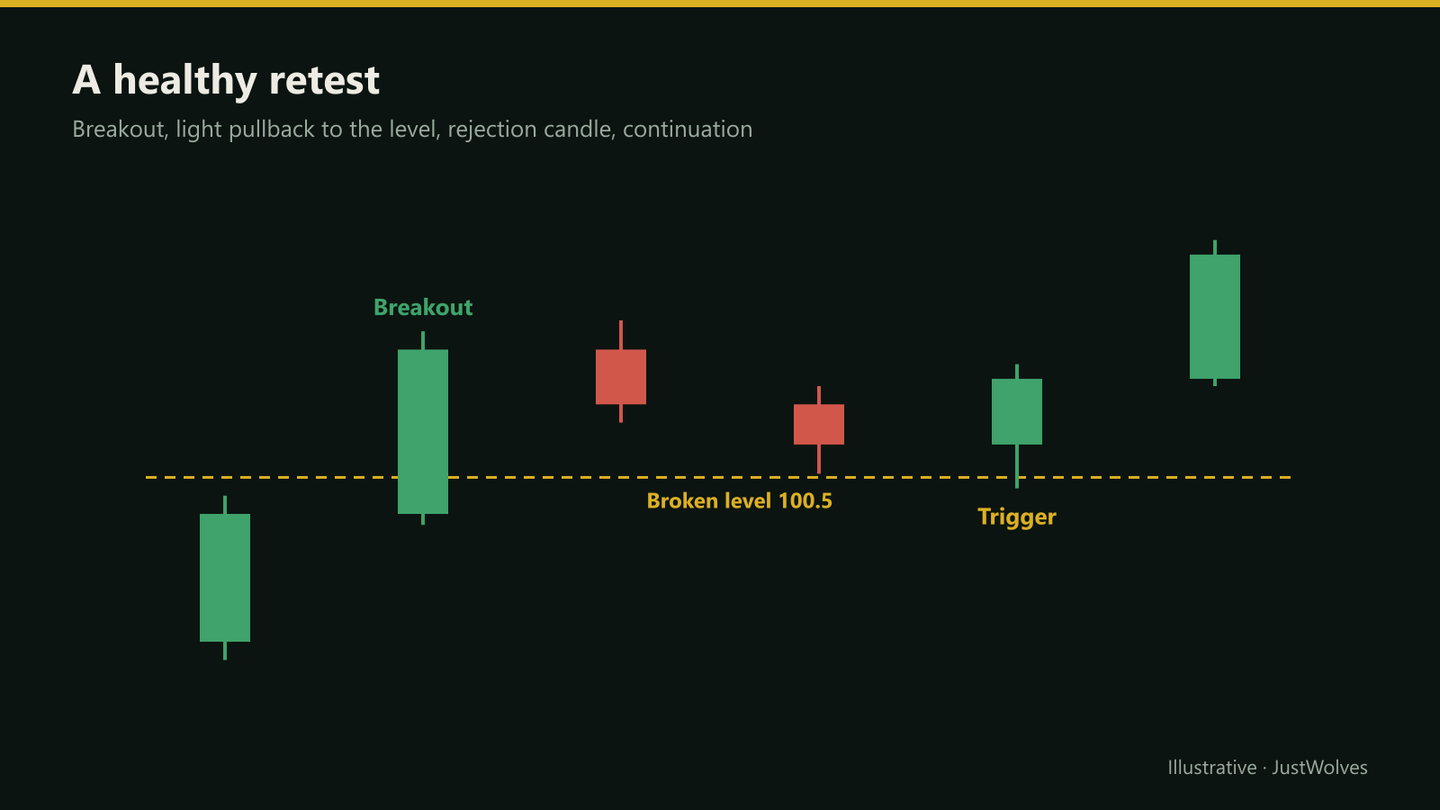
Entry Triggers
- Limit order at the level: the best price, but no confirmation the level will hold.
- Bullish candle at the level: a hammer, engulfing or strong close back up from the zone.
- Break of the retest candle's high: a buy-stop above the trigger candle.
- Lower-timeframe turn: a 60-minute higher low and break of structure at the level.
Most retest traders use one of the middle two. They give some evidence the level is holding without waiting so long that the retest advantage disappears.
Stops
The stop goes below the retest low, with a small buffer, or below the level zone, whichever is lower. A close back inside the range invalidates the setup even if the stop isn't hit.
Because the entry is near the level, the stop is usually much closer than on a breakout entry. For the same rupee risk, that allows a larger position, and the reward-to-risk to the first target improves.
Real Prices: A Healthy Retest
Farhan's example in this lesson is hypothetical. The chart below shows a breakout and retest on real Titan prices from July 2026: a high-volume breakout, an orderly pullback on lighter volume to the old resistance, and a trigger that confirmed the level was holding.
Real prices: a breakout, a light-volume retest and a trigger, Titan, July 2026
Step 1 of 4
The breakout
Titan stalls twice near ₹4,505 in early July 2026 (₹4,504.5 on 1 July, ₹4,507.7 on 3 July). On 7 July it opens above that level and closes at ₹4,604.2 on 4.3 times average volume. A breakout buyer at the close, with a stop half an ATR below the level (about ₹4,465), risks about ₹139.
- What to observe
- A strong, high-volume breakout candle.
- Condition
- Retest traders wait for price to come back.
Splitting the Entry
Some traders buy part of the position on the breakout close and add the rest on a retest. If the retest never comes, they hold a smaller winning position; if it does, their average entry improves. The stop for the whole position goes below the retest low once it forms, or back inside the range before that.
Retests on Intraday Charts
The same pattern appears intraday, for example when Nifty futures break above the previous day's high and pull back to it within the next hour. Intraday retests happen faster and with more noise, so traders usually use smaller timeframes for the trigger, such as a 5-minute bullish candle at the level, and tighter stops sized to the intraday ATR. The principles don't change: the level must hold on a closing basis, volume on the pullback should be lighter than on the break, and a close back inside the range ends the setup.
Practical Example
Hypothetically, a stock breaks above resistance at ₹455 with a close at ₹472 on heavy volume. Instead of buying at ₹472 with a stop at ₹446 (₹26 risk), Farhan waits.
Over four sessions, price drifts back on lighter volume to ₹457, and a hammer closes at ₹463. He places a buy-stop at ₹465, which fills the next morning. His stop is ₹451, below the retest low of ₹454, risking ₹14. His target is the measured move at ₹505, ₹40 above entry, about 2.9R, compared with about 1.3R from the breakout entry.
Is the Retest Worth Waiting For? Our Test
JustWolves tested this lesson's entries on about two years of daily prices for 17 large NSE stocks (November 2024 to November 2026): 419 closes above the prior 20-day high. A retest was price coming back to within a quarter of an ATR of the level within 10 days. We compared three entries: buying at the breakout close, a limit order at the level, and a trigger after the retest (a close above the previous day's high, still above the level) with the stop below the retest low. All used a 2R target. We also split the trigger entries by volume on the pullback, and tested a second retest of the same level.
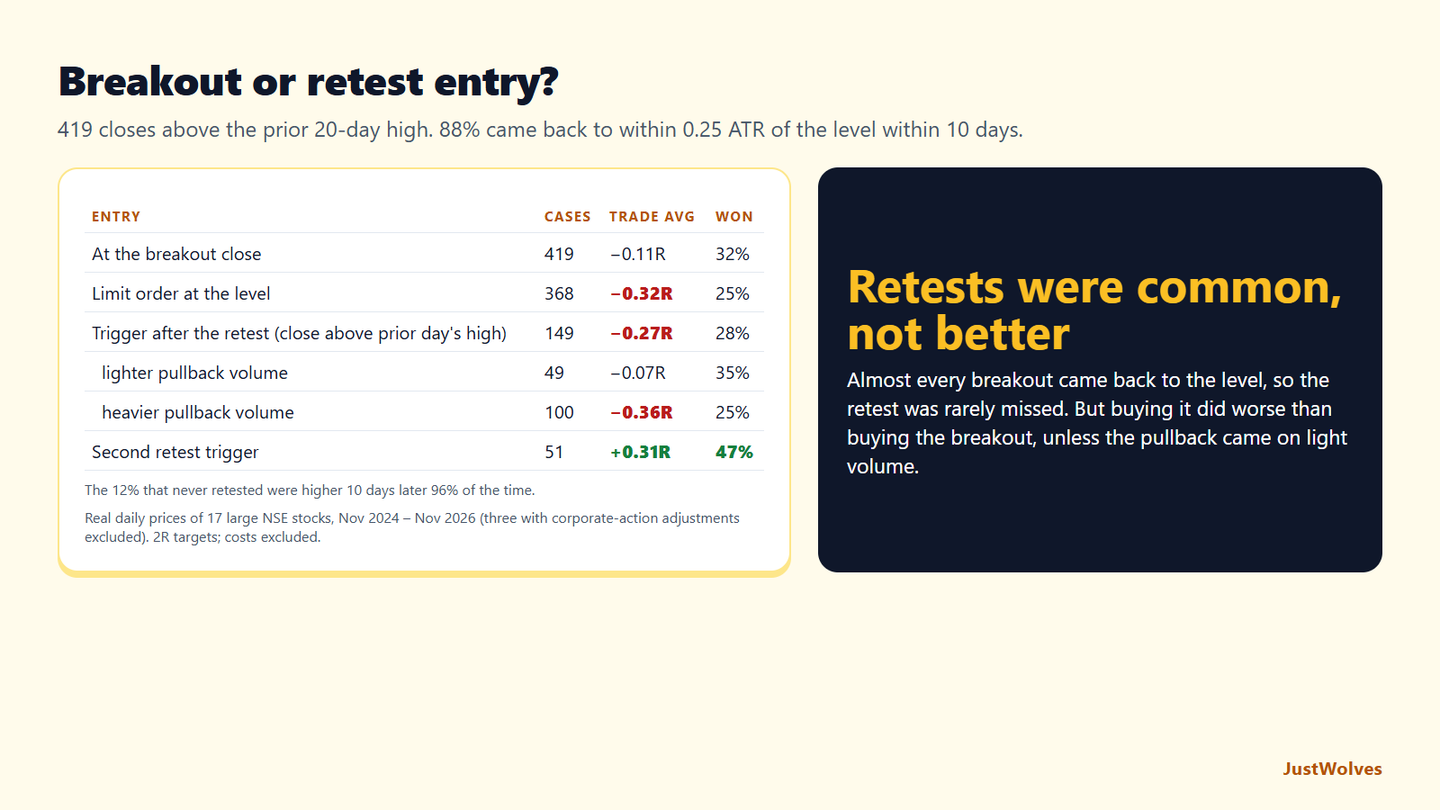
| Entry | Cases | Trade average | Won |
|---|---|---|---|
| At the breakout close (stop half an ATR below the level) | 419 | −0.11R | 32% |
| Limit order at the level, no trigger (same stop) | 368 | −0.32R | 25% |
| Trigger after the retest (stop below the retest low) | 149 | −0.27R | 28% |
| Trigger, pullback volume under 0.7× the breakout day | 49 | −0.07R | 35% |
| Trigger, heavier pullback volume | 100 | −0.36R | 25% |
| Trigger on a second retest of the level | 51 | +0.31R | 47% |
Retests were the norm, not the exception. Nearly nine in ten breakouts came back to the level within two weeks, so the fear of missing the move by waiting was mostly unfounded. The 12% that never came back were the strong ones this lesson describes: 96% were higher 10 days later.
But buying the retest did not beat buying the breakout on average. A limit order at the level without a trigger did worst, −0.32R per trade, which supports this lesson's warning against limit orders with no confirmation: many of the fills were breakouts on their way to failing. The trigger entry was better than the limit order but still behind the breakout close.
The healthy-retest test did matter. Trigger entries after a pullback on light volume, under 0.7 times the breakout day's volume, averaged −0.07R, against −0.36R when the pullback volume was heavier. That is the volume column of this lesson's table at work.
One result ran against this lesson's professional insight: trigger entries on a second retest did better than on the first, +0.31R across 51 cases. Those were breakouts that had already held once, so they were a pre-selected, stronger group; it does not mean later retests are safer in general. The practical reading: use retests for confirmation, insist on the light-volume, close-above-the-level signs, and do not expect a better average price than the breakout itself.
Common Mistakes
- Buying a retest that closed back inside the range.
- Limit orders at the level with no trigger.
- Stops right at the level where retests probe.
- Chasing after missing the retest.
- Waiting forever for a retest that never comes.
Professional Insight
Many experienced traders treat the first retest as the best one. Each later retest of the same level absorbs more of the buying there, and by the third or fourth, the level is more likely to give way. If a breakout keeps returning to the level, they become more cautious rather than more eager.
Risk Considerations
- Failed retests become false breakouts.
- Missed moves when no retest comes.
- Gaps through the level on the retest.
Important Terminology
| Term | Meaning |
|---|---|
| Retest | A return to a broken level after a breakout. |
| Role reversal | Old resistance acting as support. |
| Trigger candle | The candle that confirms the retest is holding. |
| Buy-stop | An order to buy if price rises to a set level. |
| Split entry | Entering part on the breakout and part on the retest. |
What is a breakout and retest?
A strategy that waits for price to return to a broken level after a breakout, then enters as it holds.
Do all breakouts retest?
No. Strong breakouts often continue without returning to the level.
Where should the stop go on a retest entry?
Below the retest low or the level zone, with a small buffer.
How do I know a retest is failing?
A sharp, heavy-volume fall and a close back inside the range.
Is the first retest the best?
Many traders think so; later retests of the same level tend to be weaker.
How often do breakouts retest the level?
Very often. In our test of 419 breakouts above 20-day highs on 17 NSE stocks, 88% came back to within a quarter of an ATR of the level within 10 trading days. The 12% that did not were higher 10 days later 96% of the time.
Is a retest entry better than buying the breakout?
Not on average in our NSE data: retest trigger entries averaged −0.27R per trade against −0.11R for the breakout close. Retests after light-volume pullbacks did much better (−0.07R) than heavy-volume ones (−0.36R), so the quality of the retest matters.
Practical Exercise
Track retests.
Your task
Step 1: Find 20 breakouts
On daily charts.
Step 2: Note retests
Did price return to the level within ten sessions?
Step 3: Score each retest
Healthy or failing, using the table.
Step 4: Compare entries
R-multiple from a breakout entry vs a retest entry.
Check Your Understanding
A retest entry's main advantage is:
Related Lessons
Previous: Reading the Breakout Candle. Next: Pullback and Momentum Entries After a Breakout. See also Support and Resistance Breakouts.