
Reading the Breakout Candle
JustWolves is an educational platform and is not a SEBI-registered investment advisor. Trading financial instruments involves significant risk of loss and may not be suitable for all investors. Past performance is not indicative of future results. Read our full disclaimer →
What you'll learn
- A strong breakout candle closes near its high, well beyond the level, with a body larger than usual
- A long upper wick or a close back near the level shows sellers met the breakout
- Compare the candle's range with ATR: very large candles can leave the entry too far from the stop
- Gap breakouts open beyond the level; they show strong demand but complicate entries
- The next candle matters too: follow-through or a quick reversal changes the picture
In this article · 15 sections
The candle that breaks the level carries a lot of information. Where it closes, how big its body is and whether it leaves a long wick all show how the battle at the level went. A breakout candle that closes near its high, well above resistance, tells a different story from one that pokes above and closes back near the level with a long upper wick. This lesson covers how to read breakout candles and how their shape affects entries and stops.
What You Will Learn
- What a strong breakout candle looks like
- Warning signs in the candle
- How candle size affects risk
- How to handle gap breakouts
Before You Start
Read Volume Confirmation. The Candlestick course explains candle anatomy in Candlestick Anatomy.
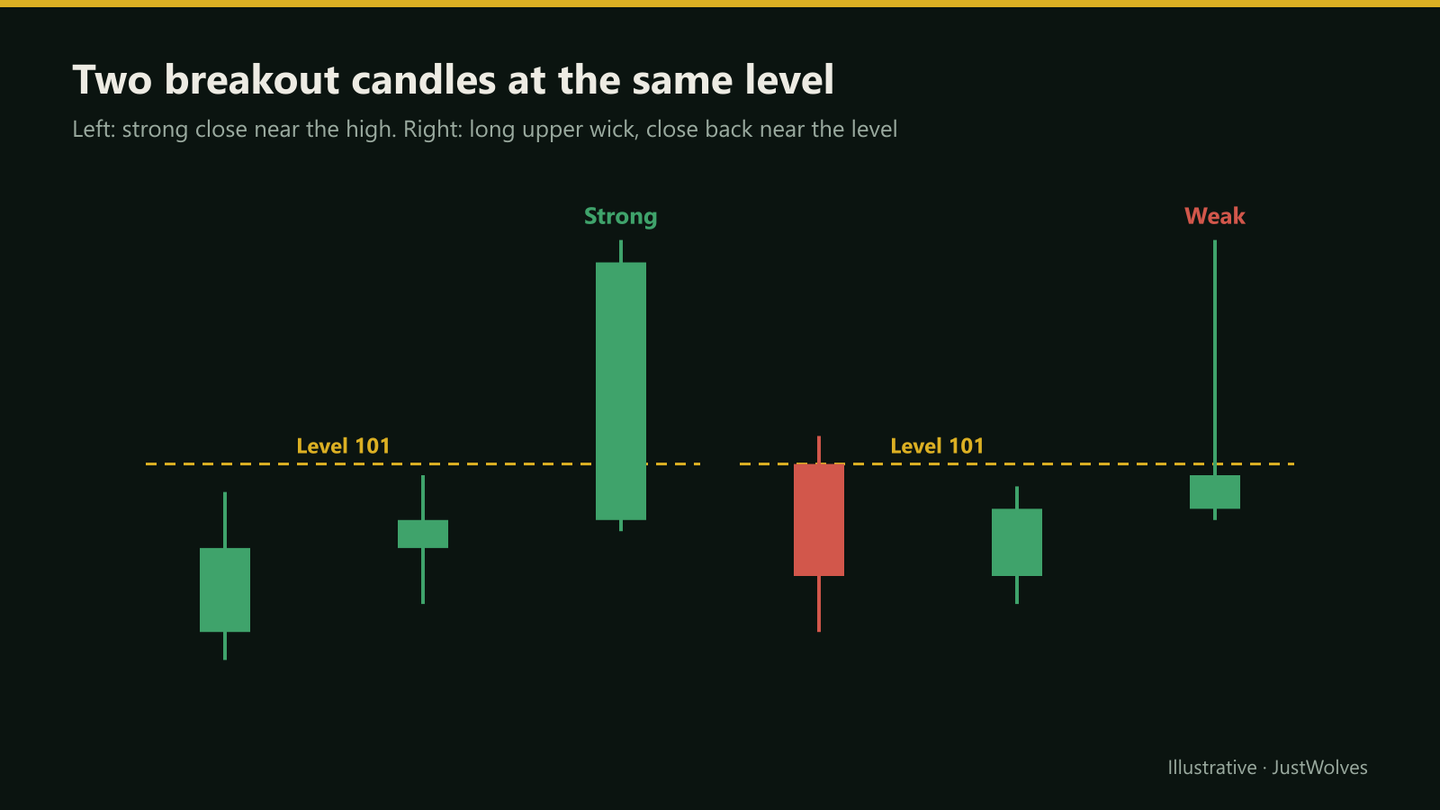
Strong vs Weak Breakout Candles
| Feature | Strong | Weak |
|---|---|---|
| Close position | Upper quarter of the range | Lower half, near the level |
| Distance from level | Closes clearly beyond it | Closes barely beyond it |
| Body size | Larger than recent candles | Small body |
| Upper wick | Short | Long, showing selling at the highs |
| Volume | Well above average | Average or below |
Close Position
One simple measure is where the close sits in the candle's range: (close − low) ÷ (high − low). A value of 0.8 means the candle closed in the top 20% of its range; 0.3 means it closed near the low.
Breakout candles that close in the top quarter show buyers in control into the close. Those that close in the lower half, especially back near the level, show sellers met the breakout and pushed it back. Many traders skip breakouts that close below the midpoint of their range.
Candle Size and ATR
A large body is a sign of strength, but a very large candle creates a practical problem: if you enter at its close and place the stop back inside the range, the stop may be far away. A breakout candle two or three times the stock's ATR can push the risk per share beyond what your sizing allows.
Common responses: reduce position size, use a stop at the candle's midpoint rather than inside the range (accepting more stop-outs), or wait for a pullback or retest to enter closer to the level.
Real Prices: A Strong Candle and a Patient Entry
Leela's example in this lesson waits for a pullback after a large breakout candle. The chart below shows the same situation on real Bharti Airtel prices from October and November 2026, a case where waiting worked. The test below shows how often it did.
Real prices: a strong breakout candle and the pullback that followed, Bharti Airtel, October–November 2026
Step 1 of 4
A level and a tightening range
Bharti Airtel rallies in mid-October 2026 to a high of ₹1,929.6 on 19 October, then holds between about ₹1,860 and ₹1,920 for a week. ATR is about ₹49.
- What to observe
- A clear level just above a short base.
- Condition
- Watch how the breakout candle closes.
Gap Breakouts
Sometimes a stock opens above the level, often after news or results. A gap breakout shows strong demand, and gaps that hold through the session can be among the strongest breakouts. But the entry is far from the level, and if the gap fills (price falls back to the previous close), the breakout often fails.
Many traders wait for the first 15 to 30 minutes to see whether the gap holds, then enter above the opening range's high with a stop below its low, rather than buying at the open. Opening Range Breakout (ORB) covers this.
The Next Candle
The candle after the breakout often confirms or undermines it. A second strong candle that holds above the level adds evidence. An inside day that holds above the level is neutral to positive. A bearish candle that closes back inside the range is a warning, and many traders exit or don't enter on it.
Practical Example
Hypothetically, a stock with resistance at ₹1,010 and ATR of ₹22 breaks out with a candle from ₹1,004 to ₹1,046, closing at ₹1,041. Its close position is (1,041 − 1,004) ÷ 42 ≈ 0.88, a strong close, but it's ₹31 above the level, about 1.4 ATR.
Rather than buy at ₹1,041 with a stop at ₹998 (₹43 risk), Leela waits. Two days later price pulls back to ₹1,018 and forms a bullish candle. She buys at ₹1,020 with a stop at ₹998, risking ₹22, half the risk per share, so she can buy twice the quantity for the same rupee risk.
Which Breakout Candles Failed? Our Test
JustWolves scored the breakout candle on 419 closes above the prior 20-day high on about two years of daily prices for 17 large NSE stocks (November 2024 to November 2026). Close position: where the close sat in the candle's range. Extension: how far the close was beyond the level, in ATR. Gap: whether the stock opened above the level. For candles more than 1 ATR beyond the level, we also checked how often price pulled back to within half an ATR of the level within five days, and what entering there would have produced.
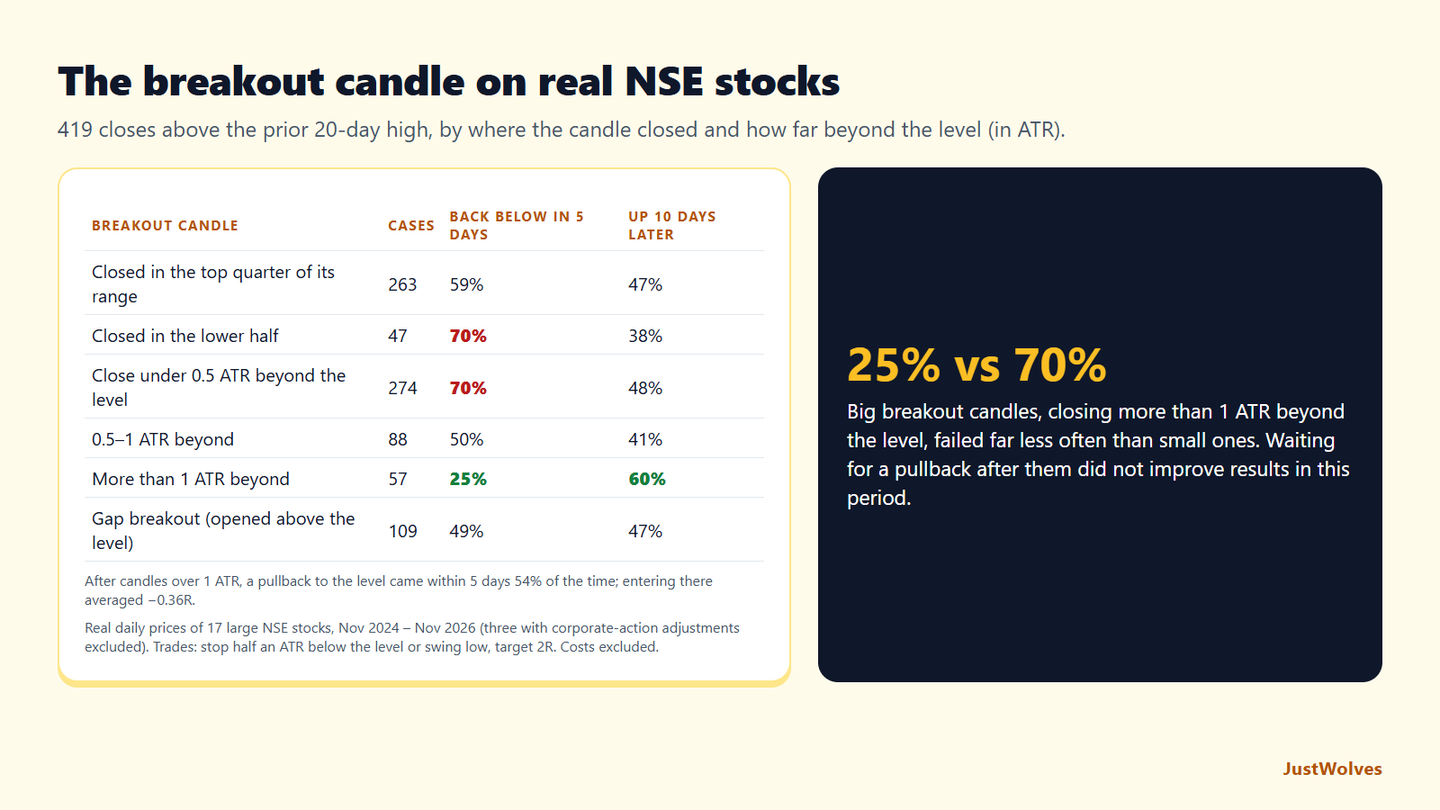
| Breakout candle | Cases | Back below within 5 days | Up 10 days later |
|---|---|---|---|
| Closed in the top quarter of its range | 263 | 59% | 47% |
| Closed in the lower half | 47 | 70% | 38% |
| Close under 0.5 ATR beyond the level | 274 | 70% | 48% |
| Close 0.5–1 ATR beyond | 88 | 50% | 41% |
| Close more than 1 ATR beyond | 57 | 25% | 60% |
| Gap breakout (opened above the level) | 109 | 49% | 47% |
| Measure | Result |
|---|---|
| Pullback to within 0.5 ATR of the level within 5 days | 54% of large-candle breakouts |
| Entry at that pullback, stop half an ATR below the level, target 2R | Average −0.36R, won 26% |
| Entry at the breakout close, same stop and target | Average −0.03R, won 37% |
Close position worked as this lesson says. Breakout candles closing in the lower half of their range failed within five days 70% of the time, against 59% for those closing in the top quarter, and were the weakest group for the 10-day move. A weak close is a reason to skip.
But size worked the other way from this lesson's callout. Candles closing more than 1 ATR beyond the level failed only 25% of the time and were higher 10 days later 60% of the time, the best group in this test. Small breakouts, closing less than half an ATR beyond the level, failed 70% of the time: those were mostly pokes that fell back. Gap breakouts also failed less often than others.
Waiting for a pullback after a big candle did not help on average. The pullback came only about half the time, and when it did, buying it averaged −0.36R, worse than entering at the breakout close (−0.03R). Pullbacks after strong candles were more often the start of a failure than a gift. The chart above shows a case where waiting worked; the data says it was the exception. The useful part of this lesson's advice remains the sizing: a large candle with a distant stop means a smaller position, not necessarily a skipped trade.
Common Mistakes
- Ignoring long upper wicks on breakout candles.
- Chasing very large candles with distant stops.
- Buying gaps at the open without waiting.
- Ignoring the next candle.
- Judging the candle intraday before it closes.
Professional Insight
Experienced traders often say the close is the most honest price of the day, because it's where traders were willing to hold overnight. A breakout that closes strongly beyond the level shows commitment; one that fades into the close shows that, by the end of the day, sellers were winning again. That is why many breakout traders wait for the daily close before acting, even if it means a slightly worse entry price.
Risk Considerations
- Extended candles create wide stops.
- Gap fills often mean failed breakouts.
- Single candles can be misleading on their own.
Important Terminology
| Term | Meaning |
|---|---|
| Close position | Where the close sits within the candle's range, from 0 to 1. |
| Upper wick | The part of the candle above the body. |
| Extension | Distance of price from the breakout level. |
| Gap breakout | An open beyond the level. |
| Gap fill | Price returning to the previous close after a gap. |
What makes a good breakout candle?
A close near the high, clearly beyond the level, with a larger than usual body and above-average volume.
What does a long upper wick on a breakout mean?
Sellers pushed price back from the highs, which weakens the breakout.
Should I buy a very large breakout candle?
Its stop may be far away. Many traders reduce size or wait for a pullback.
How should I trade a gap breakout?
Many traders wait for the opening range to form and enter above its high, with a stop below its low.
Does the candle after the breakout matter?
Yes. Follow-through supports the breakout; a close back inside the range is a warning.
Should I chase a large breakout candle?
In our NSE data, large candles were the most reliable breakouts: those closing more than 1 ATR beyond the level failed within five days only 25% of the time. If the stop is far away, reduce the position size rather than waiting for a pullback, which came only about half the time.
What does a weak close on a breakout candle mean?
It is a warning. In our test of 419 NSE breakouts, candles that closed in the lower half of their range closed back below the level within five days 70% of the time, against 59% for candles closing in the top quarter.
Practical Exercise
Score breakout candles.
Your task
Step 1: Find 20 breakouts
On daily charts.
Step 2: Calculate close position
And extension in ATR terms.
Step 3: Record outcomes
Within ten sessions.
Step 4: Compare
Did strong closes follow through more often?
Check Your Understanding
Low ₹1,004, high ₹1,046, close ₹1,041. Close position:
Related Lessons
Previous: Volume Confirmation. Next: Breakout and Retest. See also Candlestick Anatomy.