
Volatility Contraction Before Breakouts
JustWolves is an educational platform and is not a SEBI-registered investment advisor. Trading financial instruments involves significant risk of loss and may not be suitable for all investors. Past performance is not indicative of future results. Read our full disclaimer →
What you'll learn
- Volatility tends to alternate: quiet periods are often followed by larger moves
- Contraction can be measured with Bollinger Band width, falling ATR, narrow-range days (NR7) and inside bars
- A sequence of smaller and smaller pullbacks inside a base shows supply drying up
- Contraction tells you a move may be coming, not which direction it will go
- Contracted ranges allow tighter stops, which improves reward-to-risk when the breakout works
In this article · 15 sections
Markets don't move with constant energy. Periods of wide, fast swings are followed by quiet stretches of narrow candles, and quiet stretches often end with a sharp move. Breakout traders look for that quiet: it suggests the market is coiling, and it allows tight stops. This lesson covers how to recognise and measure volatility contraction, why it matters, and the important limit that it doesn't predict direction.
What You Will Learn
- Why volatility contracts and expands
- Four ways to measure contraction
- Contracting pullbacks inside a base
- How to trade a squeeze and its limits
Before You Start
Why Volatility Cycles
After a strong move, buyers and sellers gradually come into balance. Ranges narrow as fewer traders are willing to chase price in either direction. That balance doesn't last: news, a shift in demand or simply the accumulation of orders at the edges of the range tips it, and volatility expands again.
Traders sometimes summarise this as 'contraction leads to expansion'. It's a tendency rather than a law, but it's one of the more consistent behaviours in price data, and it underpins most squeeze strategies.
Measuring Contraction
| Measure | What it shows | Contraction signal |
|---|---|---|
| Bollinger Band width | Distance between bands set two standard deviations around a 20-period average | Width at its lowest in several months (a 'squeeze') |
| ATR | Average daily range over 14 periods | ATR falling steadily, well below its recent average |
| NR7 | A day with the narrowest range of the last seven | One or more NR7 days near a level |
| Inside bar | A candle within the previous candle's range | One or more inside bars at the top of a base |
All four measure the same thing in different ways, so one is enough.
Contracting Pullbacks
Inside a good base, each pullback is often smaller than the one before: perhaps 15%, then 9%, then 5%, then 3%. This sequence, popularised as the volatility contraction pattern, shows sellers becoming less active each time price approaches the top of the base.
The last, smallest contraction gives the pivot and the stop: the breakout triggers above its high, and the stop goes below its low. Because that contraction is small, the stop is tight.
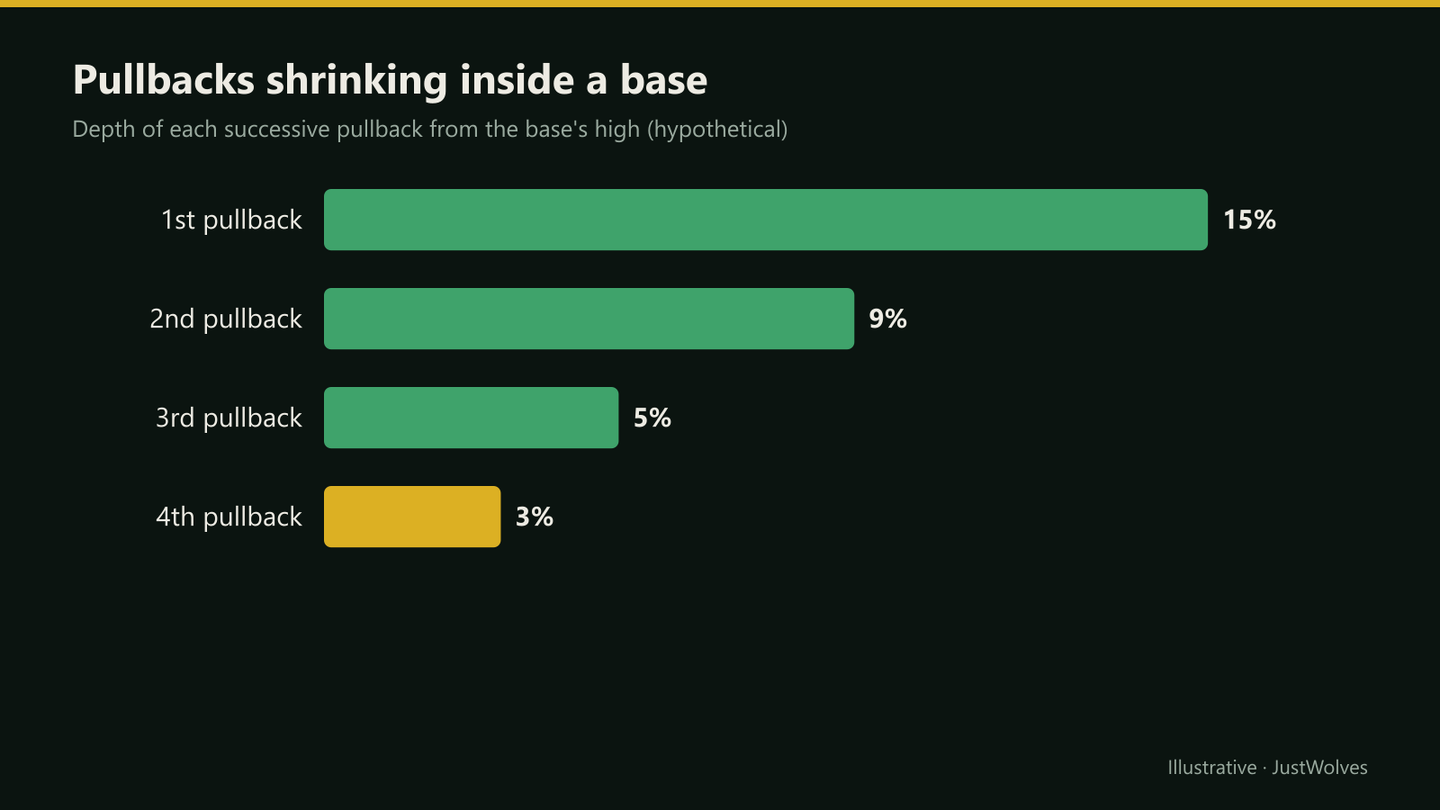
Real Prices: Shrinking Pullbacks Before a Breakout
The bar chart above uses hypothetical pullback depths. The chart below shows the same pattern on real Titan prices from December 2025 to January 2026: three successively smaller pullbacks beneath a pivot, then a breakout and an expansion.
Real prices: shrinking pullbacks and a breakout, Titan, December 2025 – January 2026
Step 1 of 4
The first pullback
In late November 2025 Titan trades near ₹3,900–3,935 in an uptrend. From early December it pulls back about 4% to ₹3,751 on 9 December, and ATR is about ₹59.
- What to observe
- The first and largest contraction.
- Condition
- Watch whether each pullback is smaller.
Contraction Doesn't Predict Direction
A squeeze tells you a larger move is more likely soon; it doesn't say whether it will be up or down. Direction comes from context: the prior trend, where the squeeze sits in the base, and the higher-timeframe picture.
A squeeze at the top of a base in an uptrend favours an upside break. A squeeze at the bottom of a range in a downtrend favours a downside break. Some traders place orders on both sides of a squeeze and cancel the one that doesn't trigger, but that only works with strict stops, because the first break can be false.
Trading a Squeeze
A simple process
Step 1: Context
A base in an uptrend, near the highs, with the weekly trend supportive.
Step 2: Contraction
Tight right side: low Bollinger width, falling ATR, or an NR7 or inside day.
Step 3: Trigger
A buy-stop above the high of the last tight area, or a close above it.
Step 4: Stop
Below the low of the tight area.
Step 5: Manage
Exit if price closes back inside; take partial profit at the first target.
Practical Example
Hypothetically, a stock in a weekly uptrend has built a base below ₹910 for six weeks. Its pullbacks have shrunk from about 12% to 6% to 3%, and its 14-day ATR has fallen from ₹28 to ₹14. The last three days are inside bars between ₹886 and ₹904.
Nisha places a buy-stop at ₹905 with a stop at ₹884, risking ₹21. It triggers two days later as the stock rises through ₹910 on strong volume. The base's depth was about ₹110, so her measured-move target is about ₹1,020, roughly 5.5R; she plans partial profit at ₹950 (about 2.1R).
Does Quiet Really Lead to Big Moves? Our Test
JustWolves tested this lesson's idea that contraction leads to expansion on about two years of daily prices for 17 large NSE stocks (November 2024 to November 2026). We compared every stock-day with two kinds of quiet day: NR7 days, the narrowest range of the last seven, and low-ATR days, when the 14-day ATR was in its lowest 20% of the previous 100 days. For each, we measured the range and the net move over the next 10 trading days. We also tested 20-day breakouts that came out of low-ATR periods.
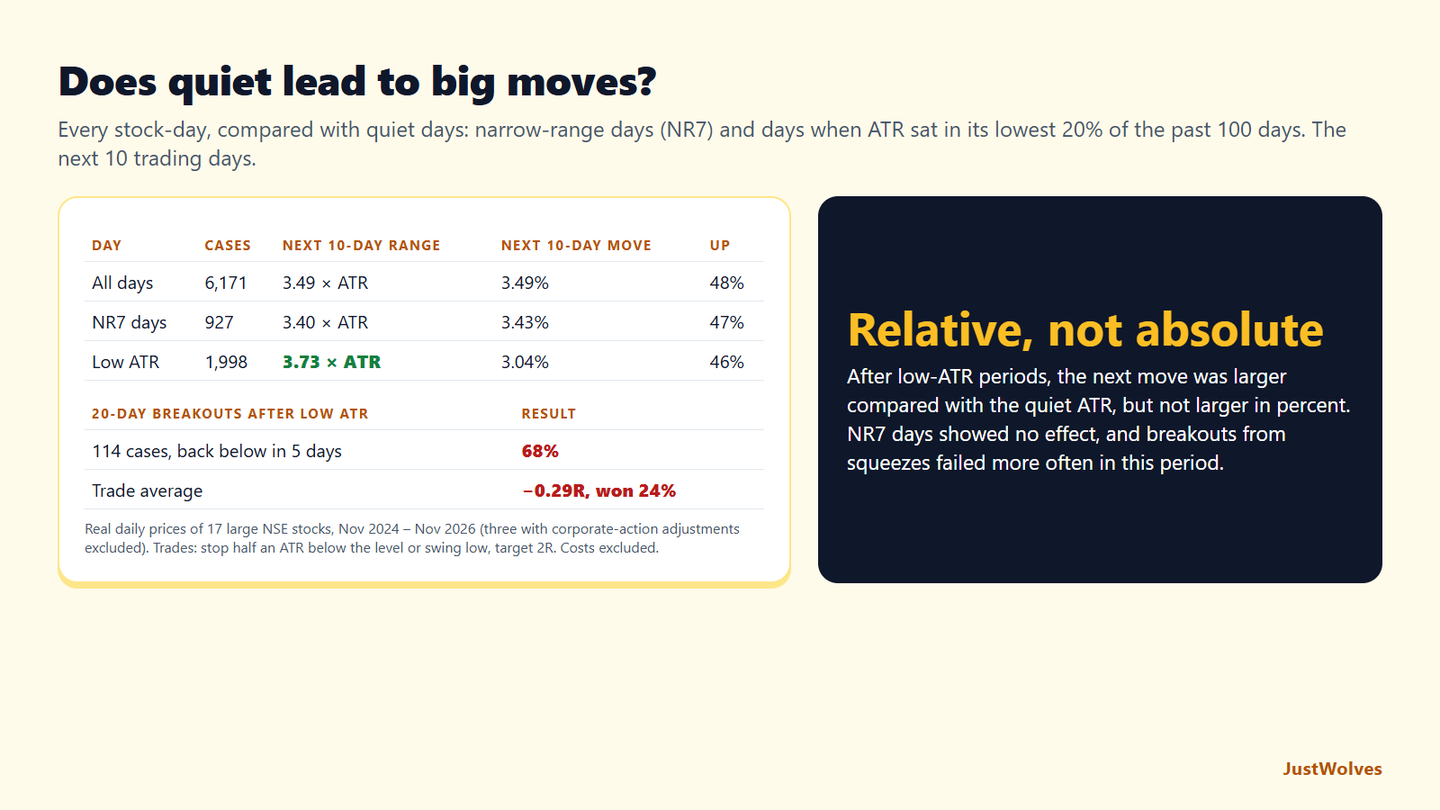
| Day | Cases | Next 10-day range | Net 10-day move | Up |
|---|---|---|---|---|
| All days | 6,171 | 3.49 × ATR | 3.49% | 48% |
| NR7 days | 927 | 3.40 × ATR | 3.43% | 47% |
| ATR in its lowest 20% of 100 days | 1,998 | 3.73 × ATR | 3.04% | 46% |
| Breakout | Cases | Back below within 5 days | Trade average | Won |
|---|---|---|---|---|
| 20-day breakout after low ATR (lowest 25%) | 114 | 68% | −0.29R | 24% |
| All 20-day breakouts, for comparison | 419 | 60% | −0.11R | 32% |
Contraction led to expansion, but only in relative terms. After low-ATR days, the next 10 days' range was larger compared with the quiet ATR, 3.73 times against 3.49 on an average day. But the move in percent was smaller, because the starting ATR was small. NR7 days showed no effect at all. So the tendency this lesson describes exists, but it is modest: quiet stocks tended to stay relatively quiet.
Direction was a coin flip, as this lesson says. Quiet days were followed by up and down moves about equally, so the squeeze itself carried no directional information.
Squeeze breakouts did worse in this period. Breakouts out of low-ATR periods closed back inside the range within five days 68% of the time, more than other breakouts. The professional insight in this lesson points to the real value of contraction: the tight stop it allows. A small last contraction, as in the Titan chart, means a failure costs little and a modest follow-through is worth several R. Treat contraction as a way to define risk, not as a forecast of a big move.
Common Mistakes
- Assuming a squeeze means up.
- Using several volatility indicators that say the same thing.
- Trading squeezes in the middle of nowhere, away from any level.
- Holding after a close back inside the range.
- Entering before the trigger because the chart 'looks ready'.
Professional Insight
Many experienced breakout traders value contraction mainly for the stop it allows. A tight area means a small risk per share, so even modest breakouts produce good R-multiples, and failures cost little. They'd rather take several small losses on squeezes that fail than one large loss on a wide, loose breakout.
Risk Considerations
- Direction is uncertain until the break.
- Tight stops can be hit by noise.
- Gaps after quiet periods can skip entries and stops.
Important Terminology
| Term | Meaning |
|---|---|
| Volatility contraction | A period of shrinking price ranges. |
| Bollinger squeeze | Band width at a multi-month low. |
| ATR | Average True Range, the typical daily range. |
| NR7 | The narrowest-range day of the last seven. |
| Inside bar | A candle within the previous candle's range. |
What is volatility contraction?
A period when price ranges shrink, often before a larger move.
What is a Bollinger Band squeeze?
When the distance between the bands narrows to a multi-month low, showing low volatility.
What is an NR7 day?
A day whose high-low range is the narrowest of the last seven sessions.
Does a squeeze tell me the breakout direction?
No. Direction comes from the trend and where the squeeze sits in the range.
Where should the stop go on a squeeze breakout?
Below the low of the tight area that formed before the breakout.
Do quiet periods lead to big moves in stocks?
Only somewhat. In our test on 17 NSE stocks, the 10 days after a low-ATR day moved about 3.7 times that day's ATR, against 3.5 times on an average day, but the move in percent was smaller. NR7 days showed no measurable effect.
Are squeeze breakouts more reliable?
Not in our data. Breakouts above 20-day highs that came out of low-ATR periods closed back below the level within five days 68% of the time, against 60% for all breakouts. Their advantage is the tight stop, not a higher success rate.
Practical Exercise
Find squeezes.
Your task
Step 1: Add one volatility tool
Bollinger Band width or ATR.
Step 2: Find ten squeezes
At least one in a downtrend.
Step 3: Record the breakout direction
And whether it matched the prior trend.
Step 4: Measure the stop
How tight was the stop below the tight area?
Check Your Understanding
Volatility contraction often precedes:
Related Lessons
Previous: Range and Consolidation Breakouts. Next module: Volume Confirmation. See also Inside Bars and Outside Bars.