
Breakout Risk Management, Backtesting and Examples
JustWolves is an educational platform and is not a SEBI-registered investment advisor. Trading financial instruments involves significant risk of loss and may not be suitable for all investors. Past performance is not indicative of future results. Read our full disclaimer →
What you'll learn
- Breakout strategies often have modest win rates; they depend on winners being larger than losers
- Small fixed risk per trade lets an account survive the losing streaks that modest win rates produce
- A market filter, trading breakouts mainly when the broad market is healthy, is one of the most useful rules
- Honest backtests include every failed breakout, realistic costs and slippage, and rules fixed in advance
- Review results by setup type and market condition, not just overall
In this article · 16 sections
Breakout trading has a particular risk profile: many small losses from failed breakouts, offset by fewer, larger gains from those that follow through. That profile is workable, but only with sizing that survives long losing streaks and with honest evidence that the winners really are large enough. This final lesson covers risk management for breakout strategies, how to backtest breakouts without fooling yourself, and two case studies that pull the course together.
What You Will Learn
- The risk profile of breakout strategies
- Sizing for losing streaks
- Market filters
- Backtesting breakouts honestly, with case studies
Before You Start
Read Breakout Stop-Loss and Target Placement. The Risk Management course explains expectancy in Win Rate, Expectancy and Profit Factor.
The Breakout Risk Profile
Because many breakouts fail, breakout strategies often have win rates below 50%. That's not a problem in itself. A strategy that wins 40% of the time, with average wins of 2.2R and average losses of 1R, has an expectancy of (0.40 × 2.2) − (0.60 × 1.0) = 0.28R per trade before costs.
The danger is in the details: if quick exits on failures slip from 1R to 1.3R, or winners are cut at 1.5R instead of 2.2R, the same win rate can produce a loss. Breakout traders need to know their actual numbers, not assumed ones.
Losing Streaks
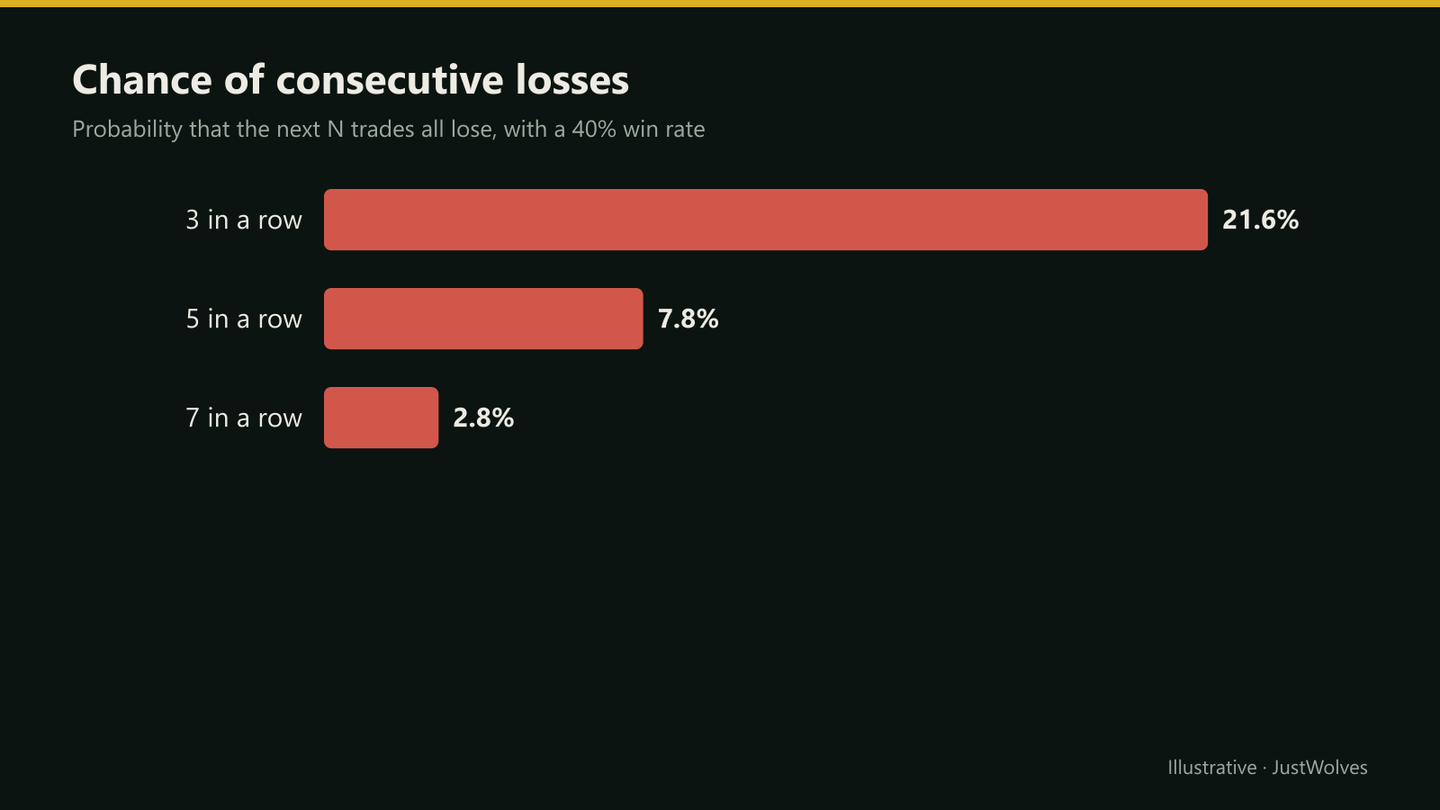
With a 40% win rate, losses come in runs. The chance that any given run of three trades are all losers is 0.6³, about 22%; for five in a row it's about 8%; for seven, about 3%. Over a hundred trades, a streak of six or seven losses at some point is quite likely.
At 1% risk per trade, seven straight losses cost about 7% of the account. At 5% per trade, they cost about 30%. That's why breakout traders typically risk 0.5–1% per trade.
Market Filters
Breakouts across many stocks tend to succeed together in healthy markets and fail together in weak ones. A simple market filter, such as taking long breakouts only when the Nifty 50 is above a rising 50-day moving average, removes many failures at once.
Other filters include the number of stocks making new highs versus new lows, or sector index trends. The specific filter matters less than having one and applying it consistently.
Backtesting Breakouts Honestly
- Fix the rules first: level definition, confirmation, entry, stop, target and time stop.
- Include every trigger, especially the failures that look obvious in hindsight.
- Use closing prices and hidden future bars to avoid look-ahead bias.
- Include costs and slippage, which are larger on stop orders and gaps.
- Test across conditions: rising, falling and sideways markets.
- Collect enough trades: dozens per setup at least, before drawing conclusions.
The How to Backtest a Trading Strategy lesson covers the process in detail.
Case Study 1: A Base Breakout That Worked
Hypothetically, in a rising market, a stock forms a seven-week base below ₹540 with tightening swings and drying volume. It breaks out on 1.8 times average volume. The trader buys at ₹548 with a stop at ₹519 (1R = ₹29), sells half at the measured move of ₹600 (1.8R), and trails the rest under the 20-day average, exiting at ₹642 (3.2R). Blended result: about 2.5R.
Review: market filter passed, base quality high, volume confirmed, plan followed. The result came from the trend continuing well beyond the measured move.
Real Prices: Case Study 1 on a Real Stock
Case Study 1 is hypothetical. The chart below follows the same plan on real Tata Steel prices from December 2025 to March 2026: a tight base in a rising market, a structural stop, half the position sold at 2R and the rest trailed under the 20-day average.
Real prices: a base breakout with a partial exit and a trailing stop, Tata Steel, December 2025 – March 2026
Step 1 of 4
A base in a rising market
Tata Steel holds between about ₹167.6 and ₹174 through the second half of December 2025, with swings narrowing. NIFTY is above a rising 50-day average. On 29 December the stock pushes to ₹174.1 on 2.3 times average volume.
- What to observe
- Case Study 1's ingredients: a tight base and a healthy market.
- Condition
- Level: ₹174.1.
Case Study 2: A Breakout That Failed
Hypothetically, in a market below its falling 50-day average, a stock closes above resistance on average volume with a long upper wick. The trader buys at ₹1,522 with a stop at ₹1,488. The next day it closes back inside at ₹1,494, and the trader exits for a loss of about 0.8R.
Review: the exit was correct and the loss was small. But the market filter failed and the breakout candle and volume were weak. Under the trader's own rules, this trade shouldn't have been taken. The lesson is about selection, not execution.
Practical Example
Hypothetically, Rohit backtests a base breakout strategy on 60 trades over three years. Before costs: 24 wins averaging 2.3R and 36 losses averaging 0.9R, an expectancy of (0.40 × 2.3) − (0.60 × 0.9) = 0.38R. After estimated costs and slippage of about 0.1R per trade, it falls to about 0.28R.
He then splits the results by market condition. Trades taken with the Nifty 50 above a rising 50-day average have a much higher expectancy than those taken below it. He adds the market filter, accepting fewer trades, and plans to paper-trade the rules for two months before using real money.
A Real Breakout Backtest: What It Showed
JustWolves ran this lesson's backtesting checklist on about two years of daily prices for 17 large NSE stocks (November 2024 to November 2026), with every rule fixed in advance. Signal: a close above the prior 20-day high. Entry: the close. Stop: a quarter of an ATR below the lowest low of the five days before the breakout. Exits: a 2R target, or a close back below the level within five days. Every signal was taken, in date order, across all 17 stocks: 419 trades. We then added 0.1R per trade for costs and slippage, as in Rohit's example, and tested this lesson's market filter.
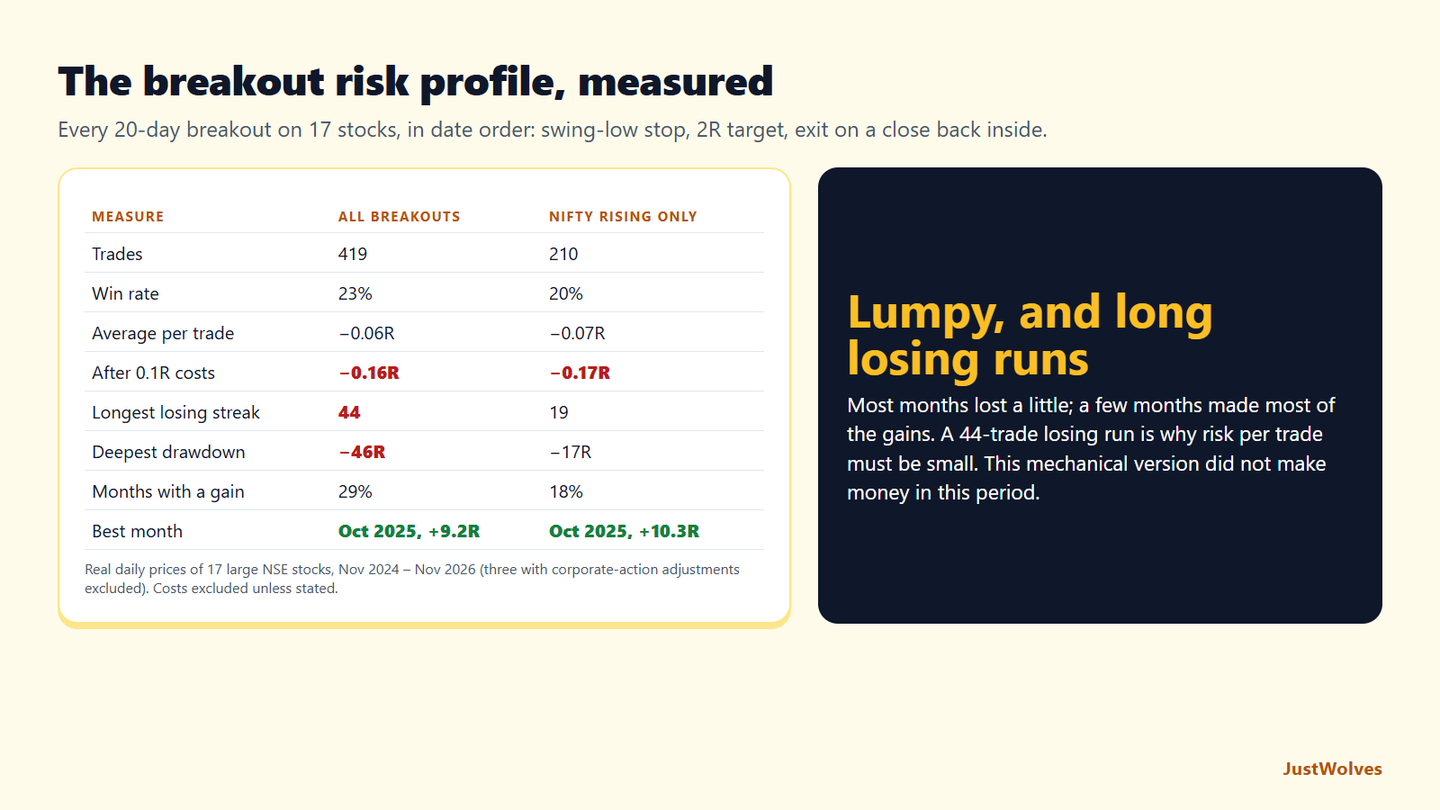
| Measure | All breakouts | NIFTY above a rising 50-day average only |
|---|---|---|
| Trades | 419 | 210 |
| Win rate | 23% | 20% |
| Average per trade before costs | −0.06R | −0.07R |
| After 0.1R costs per trade | −0.16R | −0.17R |
| Longest run of trades without a gain | 44 | 19 |
| Deepest drawdown | −46R | −17R |
| Months with a gain | 29% of 21 | 18% of 11 |
| Best month | October 2025, +9.2R | October 2025, +10.3R |
This simple strategy did not make money in this period. Before costs it lost a little, about −0.06R per trade; after 0.1R of costs, −0.16R. That is the honest result Rohit's example warns you to look for: an expectancy close to zero before costs turns clearly negative after them. The two-year window included two sharp market falls, and most mechanical setups in our tests struggled in it.
The risk profile was exactly as this lesson describes, only harsher. The win rate was 23%, because the exit on a close back inside turned many trades into small losses. The longest run of trades without a gain was 44, and the deepest drawdown was 46R. At 1% risk per trade, that is a fall of about 46% of the account before compounding, which is why this lesson's sizing advice matters more than any entry rule. With a 40% win rate, a run of six or more losses in 100 trades happened in about 89% of our simulations.
Results were lumpy. Only 29% of months made money, and a few months, October 2025 above all, produced most of the gains. That matches the professional insight in this lesson: breakout results come in clusters, and survival through the flat stretches is the job.
The market filter reduced the damage but did not create an edge. Taking breakouts only when NIFTY was above a rising 50-day average halved the number of trades, shortened the worst losing run from 44 to 19 and cut the drawdown from 46R to 17R, but the average per trade did not improve. A filter that keeps you out of bad periods is valuable for risk even when it does not raise the average.
The lesson for your own testing: fix the rules, take every signal, include costs, and look at streaks, drawdowns and monthly results, not just the average. A strategy that only works with discretionary selection, like the hand-picked cases in this course, needs that selection written down as rules before it can be tested.
Common Mistakes
- Risking too much for a strategy with a modest win rate.
- Backtests that skip failures.
- Ignoring costs and slippage on stop orders.
- No market filter.
- Judging a strategy on a handful of trades.
Professional Insight
Many experienced breakout traders describe their results as lumpy: long flat or losing stretches broken by periods when breakouts work across the market. Their risk management is designed to survive the flat stretches with capital and confidence intact, so they're still trading at full size when the good periods arrive.
Risk Considerations
- Losing streaks are normal with modest win rates.
- Backtests overstate results without costs and failures.
- Market regimes change, and with them breakout success.
Important Terminology
| Term | Meaning |
|---|---|
| Expectancy | Average result per trade, in R. |
| Losing streak | Consecutive losing trades. |
| Market filter | A rule that allows trades only in favourable market conditions. |
| Slippage | The difference between expected and actual fill price. |
| Regime | A period with a particular market character, such as trending or choppy. |
What win rate do breakout strategies have?
It varies, but many have win rates below 50%, relying on larger winners than losers.
How much should I risk per breakout trade?
Many breakout traders risk 0.5–1% of the account per trade to survive losing streaks.
What is a market filter?
A rule that allows trades only when the broad market is favourable, such as the Nifty 50 above a rising 50-day average.
How do I backtest breakouts?
Fix the rules, include every trigger and failure, use closing prices, include costs, and test across market conditions.
How long can losing streaks last?
With a 40% win rate, streaks of six or seven losses are quite likely over a hundred trades.
What is a realistic win rate for breakout trading?
Often low. In our two-year backtest of every 20-day breakout on 17 NSE stocks, with a 2R target and an exit on a close back inside, the win rate was 23%. Breakout strategies depend on wins being much larger than losses, and on surviving long losing runs.
Does a market filter improve a breakout strategy?
In our NSE backtest it reduced risk more than it raised returns. Taking breakouts only when NIFTY was above a rising 50-day average cut the deepest drawdown from 46R to 17R and the longest losing run from 44 trades to 19, but the average per trade stayed close to zero.
Practical Exercise
Run a breakout backtest.
Your task
Step 1: Write rules
For one breakout setup from this course.
Step 2: Test 50 trades
Across at least ten stocks and three years.
Step 3: Calculate expectancy
Before and after costs.
Step 4: Split by market condition
And decide whether to add a market filter.
Check Your Understanding
Win rate 40%, average win 2.2R, average loss 1R. Expectancy:
Related Lessons
Previous: Breakout Stop-Loss and Target Placement. This completes the Breakout Trading course. See also Trade Journal, Backtesting and Case Studies.