
Chart Pattern Breakouts: Triangles, Flags and Pennants
JustWolves is an educational platform and is not a SEBI-registered investment advisor. Trading financial instruments involves significant risk of loss and may not be suitable for all investors. Past performance is not indicative of future results. Read our full disclaimer →
What you'll learn
- Triangles, flags and pennants are consolidations with a recognisable shape; the breakout is the exit from that shape
- Ascending triangles (flat top, rising lows) favour upside breaks; descending triangles favour downside breaks
- Flags and pennants are short pauses after a sharp move, usually broken in the direction of that move
- Measured moves use the pattern's height or the flagpole's length, but they're guides, not forecasts
- Stops go inside the pattern beyond the last swing; a close back inside is the failure signal
In this article · 15 sections
Chart patterns are consolidations with a shape: price compresses between converging lines, or pauses in a small channel after a sharp move. Breakout traders use these shapes to define exactly where a breakout triggers and where it fails. This lesson covers the three pattern families most used for breakouts (triangles, flags and pennants), how to trade them, and the measured-move targets associated with each.
What You Will Learn
- How to identify triangles, flags and pennants
- Where each breakout triggers
- Measured-move targets
- Stops and failure signals
Before You Start
Read Previous-Day High/Low and Weekly Breakouts and Continuation Patterns: Triangles, Flags, Pennants and Wedges.
Triangles
| Type | Shape | Usual bias |
|---|---|---|
| Ascending | Flat resistance, rising lows | Upside break |
| Descending | Flat support, falling highs | Downside break |
| Symmetrical | Falling highs and rising lows | Neutral; often breaks with the prior trend |
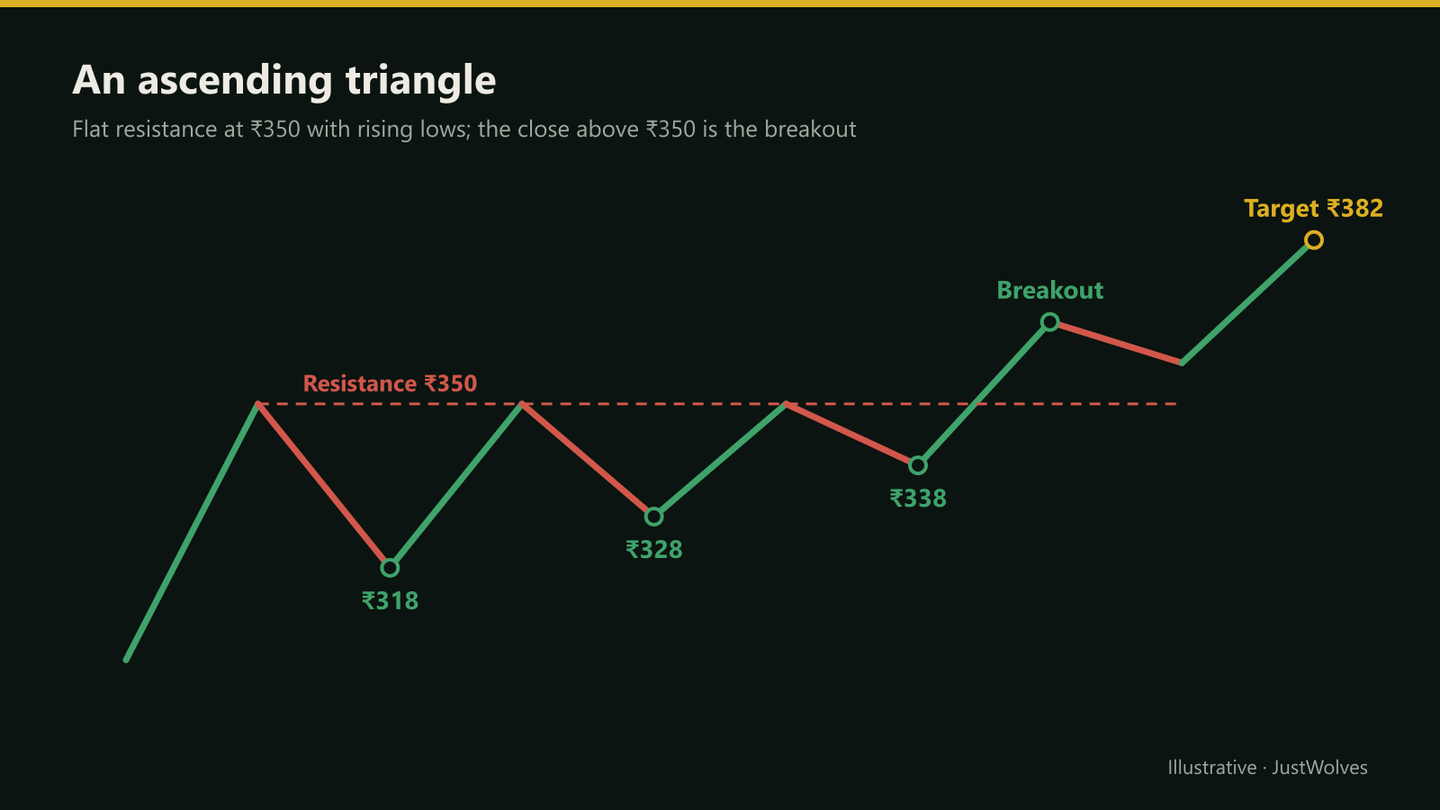
An ascending triangle shows buyers stepping in at higher and higher prices while sellers hold a fixed level. Each test of the flat top absorbs supply. A close above the flat top is the breakout. Descending triangles are the mirror image.
Symmetrical triangles show both sides narrowing. They can break either way, though they often resolve in the direction of the trend that preceded them. Many traders wait for the break rather than guessing.
Flags and Pennants
A flag is a short, orderly consolidation after a sharp move (the flagpole), usually sloping slightly against it, in a narrow parallel channel. A pennant is similar but forms a small symmetrical triangle instead of a channel. Both typically last from a few sessions to a few weeks on daily charts.
The breakout is a close beyond the flag's or pennant's boundary in the direction of the flagpole. Volume usually falls during the pause and rises on the break.
Measured Moves
| Pattern | Measured move |
|---|---|
| Triangle | Height at the widest part, added to the breakout point |
| Flag or pennant | Length of the flagpole, added to the breakout point |
| Rectangle (range) | Range height, added to the breakout level |
These targets are traditional guides, not predictions. Check them against the next higher-timeframe level, and consider partial profit at the measured move with a trailing stop on the remainder.
Stops and Failure
For an ascending triangle, the stop usually goes below the last rising low inside the pattern. For flags and pennants, it goes below the pattern's low. A close back inside the pattern soon after the breakout is the main failure signal, and many traders exit then rather than waiting for the full stop.
Patterns are subjective: two traders can draw the same triangle differently. Using closing prices, clear swing points and a minimum number of touches (often two on each side) reduces the ambiguity.
Real Prices: A Flag and Its Measured Move
The triangle above is a schematic. The chart below shows a flag on real ICICI Bank prices from June and July 2026: a sharp pole, a tight pause, a close above the pattern, and a measured-move target that price approached but did not quite reach.
Real prices: a flag breakout and its measured move, ICICI Bank, June–July 2026
Step 1 of 4
The flagpole
ICICI Bank rises from ₹1,243 on 8 June 2026 to ₹1,362.7 on 15 June: about ₹120 in five sessions, nearly five times its daily ATR of about ₹25, with volume up to twice average.
- What to observe
- A sharp, fast move: the flagpole this lesson describes.
- Condition
- Now watch for an orderly pause.
A Note on Wedges
Wedges look like triangles but both lines slope the same way. A rising wedge, with both highs and lows rising but converging, often appears late in an advance and tends to break downward. A falling wedge is the mirror image and tends to break upward. Because the break is usually against the wedge's slope, wedges behave more like reversal patterns than continuation patterns, and they need the same confirmation as other reversals: a close beyond the boundary, ideally followed by a change in swing structure.
Practical Example
Hypothetically, a stock forms an ascending triangle over seven weeks, with resistance at ₹350 and rising lows at ₹318, ₹328 and ₹338. Volume falls as the pattern narrows. Price closes at ₹354 on 1.9 times average volume.
Sneha buys at ₹353 with a stop at ₹336, below the last rising low with a small buffer, risking ₹17. The triangle's height at its widest is ₹32, so the measured move is ₹382, ₹29 above entry, about 1.7R. She plans to sell half there and trail the rest.
How Reliable Were Pattern Breakouts? Our Test
JustWolves tested this lesson's patterns on about two years of daily prices for 17 large NSE stocks (November 2024 to November 2026), with strict mechanical definitions. Ascending triangles: at least two highs within 1.5% of a flat top and at least two rising lows over 15 to 45 sessions, then a close above the top. Flags: a pole of at least 3 ATR in eight sessions or fewer, then a pause of 3 to 10 sessions in the upper half of the pole and narrower than half its length, then a close above the pause. Stops went a quarter of an ATR below the pattern's low point (the last rising low for triangles). We compared the measured-move target with a fixed 2R target.
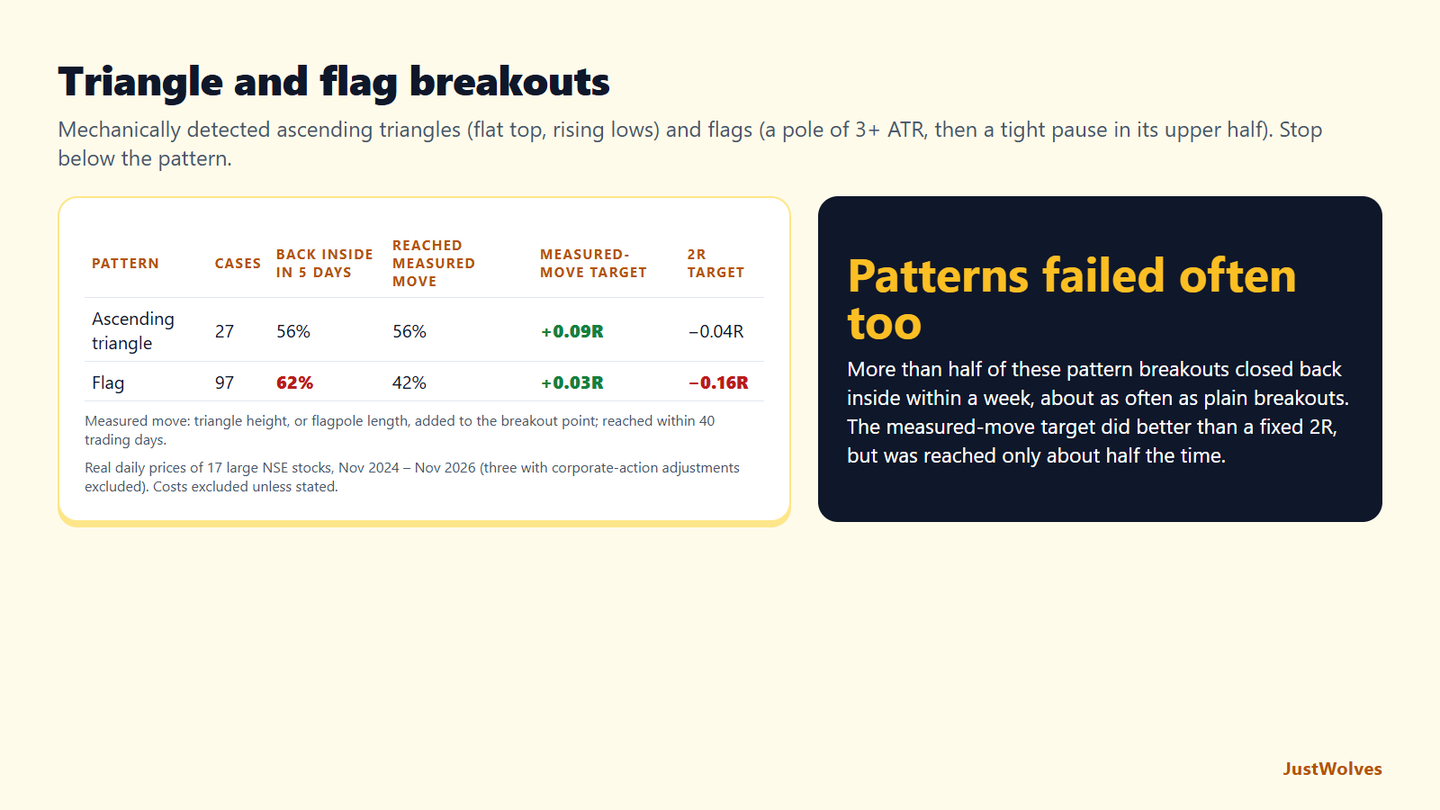
| Pattern | Cases | Back inside within 5 days | Reached the measured move | Measured-move target | 2R target |
|---|---|---|---|---|---|
| Ascending triangle | 27 | 56% | 56% | +0.09R | −0.04R |
| Flag | 97 | 62% | 42% | +0.03R | −0.16R |
Patterns did not stop breakouts failing. More than half of the triangle breakouts, and 62% of flag breakouts, closed back inside the pattern within a week, about as often as plain 20-day breakouts. This supports the callout in this lesson: the shape is not a reason to buy, and the close back inside is the signal to act on.
Measured moves were useful but unreliable. Triangles reached their measured move a little over half the time and flags 42% of the time, so the target is a guide, as this lesson says. Even so, using the measured move as the target did better than a fixed 2R for both patterns. The measured move adapts to the pattern: it asks more of a large triangle and less of a small flag.
The samples are small. Strict triangle definitions found only 27 cases in two years across 17 stocks, which echoes the professional insight in this lesson: the stricter the definition, the fewer the trades. Small samples mean these figures could change a lot with more data. The practical points hold up, though: wait for the close beyond the pattern, keep the stop inside it, act on a close back inside, and treat measured moves as places to take some profit rather than certainties.
Common Mistakes
- Entering before the break because the shape looks right.
- Seeing patterns everywhere with loose rules.
- Ignoring the prior trend for symmetrical triangles.
- Treating measured moves as certain.
- Flags that have lasted too long, turning into ranges.
Professional Insight
Experienced pattern traders tend to be strict about what counts. A flag that drifts for six weeks isn't a flag; a triangle with only one touch on one side isn't a triangle. The stricter the definition, the fewer the trades, and in many traders' records, the better the results.
Risk Considerations
- False breaks from triangles are common.
- Subjective drawing changes trigger levels.
- Late-stage patterns in extended trends fail more often.
Important Terminology
| Term | Meaning |
|---|---|
| Ascending triangle | Flat resistance with rising lows. |
| Descending triangle | Flat support with falling highs. |
| Symmetrical triangle | Converging highs and lows. |
| Flag | A short, orderly channel after a sharp move. |
| Pennant | A small symmetrical triangle after a sharp move. |
How do I trade an ascending triangle breakout?
Wait for a close above the flat resistance, enter with a stop below the last rising low, and use the triangle's height for a target.
What is the difference between a flag and a pennant?
A flag is a small parallel channel; a pennant is a small symmetrical triangle. Both follow a sharp move.
How do I calculate a flag target?
Add the length of the flagpole to the breakout point.
Which way do symmetrical triangles break?
Either way. They often break in the direction of the prior trend, but waiting for the break is safer.
How reliable are chart pattern breakouts?
They fail often. Volume, trend and strict pattern rules improve the odds.
How often do flag breakouts reach their measured move?
In our test of 97 mechanically defined flags on 17 NSE stocks, 42% reached the flagpole-length target within 40 trading days, and 62% closed back inside the flag within five days of the breakout.
Are ascending triangle breakouts reliable?
Less than often claimed. In our two-year NSE test, 56% of ascending triangle breakouts closed back below the flat top within five days, though 56% also reached their measured move within 40 trading days. The sample was small at 27 cases.
Practical Exercise
Catalogue patterns.
Your task
Step 1: Find ten examples of each
Ascending triangles, flags and pennants.
Step 2: Apply strict rules
Minimum touches, maximum duration, prior trend.
Step 3: Record outcomes
Did each reach its measured move or fail?
Step 4: Compare
Which pattern worked best in your sample?
Check Your Understanding
An ascending triangle has:
Related Lessons
Previous: Previous-Day High/Low and Weekly Breakouts. Next module: False Breakouts, Bull Traps and Bear Traps. See also Continuation Patterns: Triangles, Flags, Pennants and Wedges.