
Range and Consolidation Breakouts
JustWolves is an educational platform and is not a SEBI-registered investment advisor. Trading financial instruments involves significant risk of loss and may not be suitable for all investors. Past performance is not indicative of future results. Read our full disclaimer →
What you'll learn
- A base is a sideways consolidation after a prior move; a breakout from it can start the next leg
- Good bases are tight, orderly and often tighten towards the right side
- In an uptrend, bases that form near highs tend to be stronger than deep, sloppy ones
- The measured-move target adds the range height to the breakout level
- A close back inside the range soon after the breakout is the main failure signal
In this article · 15 sections
Markets alternate between moving and resting. The resting phases, ranges or bases, are where breakout traders do most of their preparation. A stock that rises, then moves sideways for several weeks in a tight range, is building the setup for its next potential move. This lesson covers what distinguishes a good base from a messy one, how to mark the breakout point, and how to set targets and recognise failure.
What You Will Learn
- What makes a good base
- How to mark the breakout pivot
- Measured-move targets
- Early signs of breakout failure
Before You Start
What Makes a Good Base
| Feature | Good base | Poor base |
|---|---|---|
| Prior trend | Forms after an advance, in an uptrend | Forms in a downtrend |
| Depth | Shallow relative to the prior move | Deep, giving back most of the advance |
| Shape | Orderly, overlapping candles | Wide, erratic swings |
| Right side | Swings tighten towards the breakout point | Swings stay wide |
| Volume | Tends to dry up inside the base | Heavy selling days inside the base |
| Length | Several weeks on daily charts | A few days, or a sprawling many months |
None of these is a hard rule, but together they describe a base where selling is being absorbed quietly, rather than one where buyers and sellers are still fighting.
The Breakout Pivot
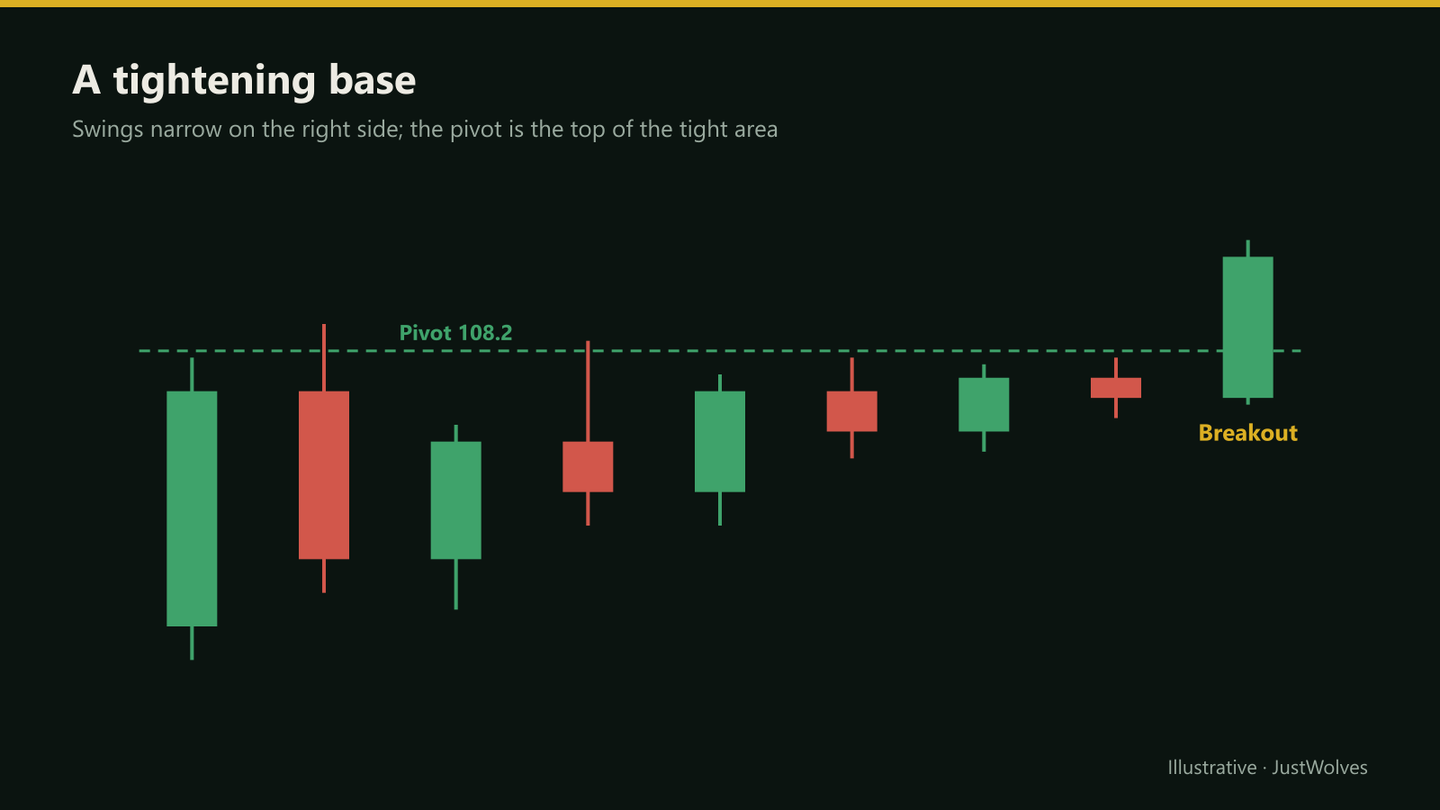
The pivot is the price whose break signals the breakout, usually the top of the base or the high of the tightest area on its right side. Marking it in advance gives you an exact trigger and lets you set an alert or a buy-stop.
In a base whose right side tightens, the pivot is often a little below the base's absolute high. Some traders prefer that earlier pivot for a closer stop; others wait for the base's high to clear for more confirmation.
Measured-Move Targets
The classic target for a range breakout adds the range's height to the breakout level. A base from ₹480 to ₹540 is ₹60 high, so a breakout above ₹540 projects to about ₹600.
Measured moves are guides, not promises. Strong breakouts can travel much further; weak ones stall well short. Check whether there's higher-timeframe resistance between the breakout and the target, and adjust.
Signs of Failure
- A close back inside the range within a few sessions of the breakout.
- Breakout on low volume, followed by heavy selling.
- No follow-through: several small candles hovering just above the pivot.
- A broad market sell-off dragging the stock back.
Market Conditions Matter
Base breakouts tend to work best when the broader market is in an uptrend. When the Nifty 50 and the stock's sector index are rising, more stocks break out of bases and more of those breakouts follow through. When the broad market is falling, even well-formed bases often fail, because selling across the market drags individual stocks back into their ranges.
A simple filter many traders use is to check the index before taking a breakout: is it above a rising 50-day moving average, and is its own structure making higher highs and higher lows? If not, they either reduce position size, require a stronger setup, or wait.
Sector strength helps too. A breakout in a stock whose sector is also breaking out has more buyers behind it than one where the stock is moving alone. Checking the sector index chart takes a minute and filters out many isolated breakouts that struggle to follow through.
Real Prices: A Good Base in a Good Market
Divya's example in this lesson describes a tight base breaking out. The chart below shows one on real State Bank of India prices from October 2025, meeting each of the conditions in this lesson's good-base table and market section.
Real prices: a shallow base breakout in a rising market, State Bank of India, October 2025
Step 1 of 4
A shallow, tightening base
After a strong September, SBI moves sideways from late September to mid-October 2025 between about ₹857 and ₹895: a base only about 5% deep. In the final week, swings narrow to ₹872–895 and RSI holds in the 60s. NIFTY is above a rising 50-day average.
- What to observe
- Tight, shallow, after an uptrend, in a rising market: this lesson's good-base table.
- Condition
- Pivot: the base high at ₹894.8.
Practical Example
Hypothetically, after rising from ₹380 to ₹540, a stock builds a seven-week base between ₹480 and ₹540. In the last two weeks, swings narrow to ₹522–₹538, and volume falls. Divya marks the pivot at ₹538.
The stock closes at ₹546 on volume 1.8 times its average. She buys at ₹548 with a stop at ₹519, below the tight area, risking ₹29. Her measured-move target is ₹600 (range height ₹60 above ₹540), about 1.8R; she plans to sell half there and trail the rest.
Which Base Conditions Mattered? Our Test
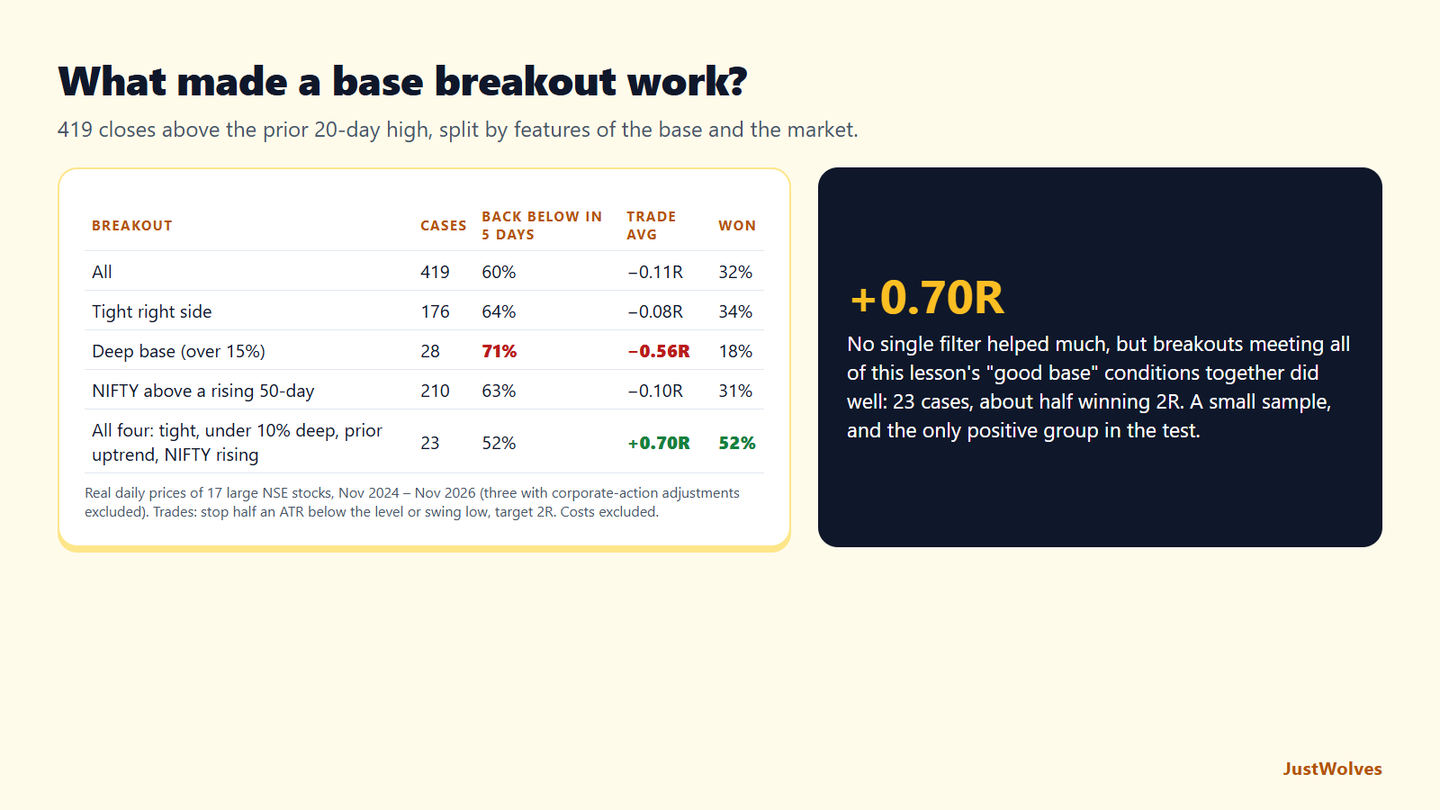
JustWolves tested this lesson's good-base checklist on about two years of daily prices for 17 large NSE stocks (November 2024 to November 2026): 419 closes above the prior 20-day high. We tagged each by right-side tightness (the last five days' range under half the base range), depth (the base's height as a share of its top), prior uptrend, and market (NIFTY above a rising 50-day average). Trades used a stop half an ATR below the pivot and a 2R target.
| Breakout | Cases | Back below in 5 days | Trade average | Won |
|---|---|---|---|---|
| All | 419 | 60% | −0.11R | 32% |
| Tight right side | 176 | 64% | −0.08R | 34% |
| Shallow base (under 8% deep) | 168 | 60% | −0.01R | 33% |
| Deep base (over 15% deep) | 28 | 71% | −0.56R | 18% |
| After a prior uptrend | 89 | 61% | −0.14R | 29% |
| NIFTY above a rising 50-day average | 210 | 63% | −0.10R | 31% |
| All together: tight, under 10% deep, prior uptrend, NIFTY rising | 23 | 52% | +0.70R | 52% |
One condition at a time, the checklist barely helped. A tight right side, a shallow base or a rising market each moved the results only slightly, and none turned the average positive. Deep, loose bases were clearly worse: 71% failed within five days and the average trade lost more than half an R, which supports this lesson's warning about wide, deep bases.
All of the conditions together made the difference. The 23 breakouts that met every condition, a tight right side, a base under 10% deep, a prior uptrend and a rising NIFTY, won about half the time with a 2R target and averaged +0.70R. That is the only group in our breakout tests so far that made money, and it matches the professional insight in this lesson: the quality of the setup before the break matters more than the break itself.
Twenty-three cases is a small sample, and these were picked by mechanical rules after the fact, so treat the figure as encouragement to be selective rather than as an expected return. The practical rule is clear, though: take base breakouts when all the conditions line up, and pass on the rest.
Common Mistakes
- Buying breakouts from deep, sloppy bases.
- Ignoring the prior trend.
- Entering far above the pivot.
- Holding a breakout that has closed back inside the range.
- Treating measured moves as certain.
Professional Insight
Experienced base breakout traders often say they're looking for evidence that sellers have run out before the breakout, not just that buyers turn up on the day. Shrinking swings, quiet volume and higher lows inside the base are that evidence. The breakout day then only needs modest demand to move price.
Risk Considerations
- Failed breakouts reverse quickly.
- Wide bases need wide stops.
- Market conditions affect breakout success.
Important Terminology
| Term | Meaning |
|---|---|
| Base | A sideways consolidation, often after an advance. |
| Pivot | The price whose break triggers the breakout. |
| Right side | The most recent part of the base. |
| Measured move | Range height added to the breakout level. |
| Follow-through | Continued movement after the breakout. |
What is a range breakout?
Price closing beyond the top or bottom of a sideways range, signalling a possible new move.
What is a base in trading?
A sideways consolidation, usually after an advance, from which a breakout may start the next leg.
How long should a base be?
On daily charts, several weeks is common. Very short or very long bases tend to be less reliable.
How do I calculate a range breakout target?
Add the range's height to the breakout level.
How do I know a range breakout has failed?
A close back inside the range soon after the breakout is the main warning.
What makes a good base for a breakout?
In our test on 17 NSE stocks, breakouts worked best when several conditions were met together: a tight right side, a base under about 10% deep, a prior uptrend and NIFTY above a rising 50-day average. Those 23 cases averaged +0.70R per trade; single conditions did little.
Do deep bases make good breakouts?
Not in our data. Breakouts from bases more than 15% deep closed back inside the base within five days 71% of the time and averaged −0.56R per trade, the worst group in our test.
Practical Exercise
Study bases.
Your task
Step 1: Find 15 bases
On daily charts of stocks in uptrends.
Step 2: Score each
Using the good vs poor table.
Step 3: Mark pivots and outcomes
Did the breakout reach its measured move?
Step 4: Compare
Did higher-scoring bases do better?
Check Your Understanding
A good base usually:
Related Lessons
Previous: Trendline Breakouts. Next: Volatility Contraction Before Breakouts. See also Consolidation and Trading Ranges.