
Pullback and Momentum Entries After a Breakout
JustWolves is an educational platform and is not a SEBI-registered investment advisor. Trading financial instruments involves significant risk of loss and may not be suitable for all investors. Past performance is not indicative of future results. Read our full disclaimer →
What you'll learn
- Missing the breakout doesn't mean missing the move: later entries exist
- The first pullback after a breakout is often the best second chance
- Tight flags that form above the breakout level offer entries with close stops
- In strong trends, pullbacks to the rising 10 or 20-day average can provide entries
- Avoid entering when price is far from any level you can place a stop against
In this article · 15 sections
Breakouts often happen when you're not watching, or move too quickly to enter safely. The temptation is to chase: buy wherever price is, with a stop far away or no stop at all. A better approach is to wait for a structured second entry: the first pullback, a tight flag above the breakout level, or a test of a rising short-term average. This lesson covers those entries and how to avoid chasing extended moves.
What You Will Learn
- Why chasing breakouts is costly
- The first pullback entry
- Post-breakout flags
- Using short-term moving averages in strong moves
Before You Start
Why Chasing Is Costly
Buying a stock three or four days after a breakout, when it has already moved several ATRs beyond the level, has two problems. The logical stop, back below the breakout level, is far away, so either the position is small or the risk is large. And extended moves often pause or pull back soon after, so the entry is likely near a short-term high.
A simple rule many traders use: don't enter more than about 1 to 1.5 ATR above the nearest level you can place a stop against. If price is further away, wait for it to build a new structure.
The First Pullback
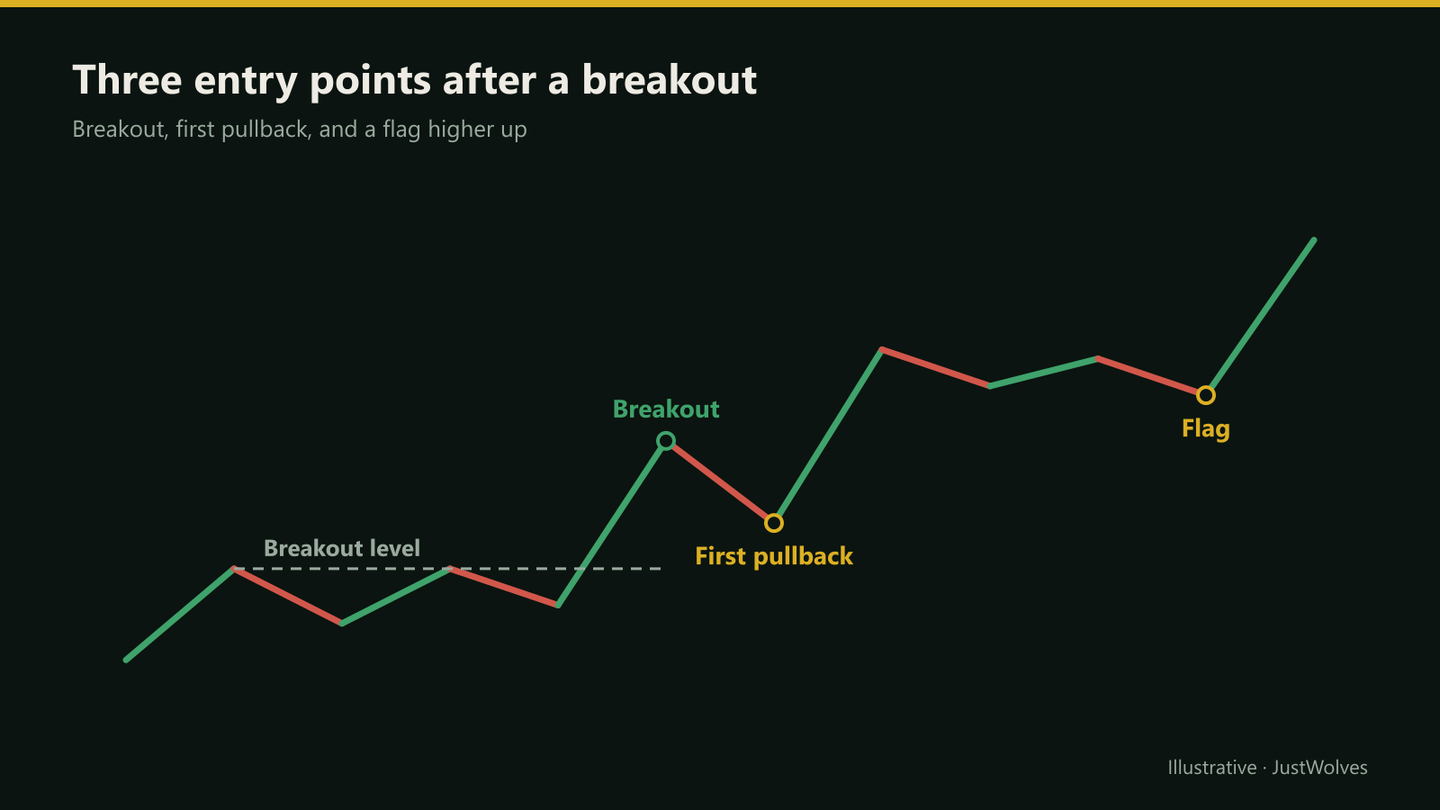
After a strong breakout, the first pause usually comes within a few sessions to a few weeks. It may retest the breakout level or hold well above it. Either way, it offers a new swing low to place a stop under.
Entry is on a trigger as the pullback ends: a bullish candle, a break of the previous day's high, or a lower-timeframe break of structure. The stop goes below the pullback low. The first pullback after a breakout tends to be more reliable than later ones, because the breakout's demand is still fresh.
Real Prices: Chasing vs the First Pullback
Mohan's example in this lesson is hypothetical. The chart below shows the same choice on real Reliance Industries prices from October and November 2025: a fast breakout, a tempting extended price, and a first pullback that offered a far closer stop.
Real prices: not chasing, then buying the first pullback, Reliance Industries, October–November 2025
Step 1 of 4
A breakout you missed
Reliance trades between about ₹1,365 and ₹1,400 in early October 2025. On 20 October it opens higher and closes at ₹1,466.8 on 2.2 times average volume, well above its 20-day high of ₹1,423.3. The move is already about 2.4 ATR beyond the level by the close.
- What to observe
- A strong breakout, but it happened fast.
- Condition
- ATR is about ₹20.
Post-Breakout Flags
Sometimes price doesn't pull back much at all. It moves sideways in a tight, slightly downward-sloping range above the breakout level: a flag. Flags that hold above the breakout level show buyers refusing to let price fall back.
The entry is above the flag's high, and the stop below its low. Because flags are tight, these entries can have small stops even though price is above the original breakout.
Short-Term Moving Averages
In very strong moves, pullbacks may be too shallow to reach the breakout level. Some traders use a rising 10-day or 20-day average as a dynamic support: they enter on a bullish candle at the average, with a stop below the pullback low.
This works only while momentum is strong and the average is rising steeply. Once price closes below the average and it flattens, the momentum phase is likely over.
Momentum Entries
A further option is buying a break to new highs after a short consolidation, accepting that the entry is high but the stop, below the consolidation, is close. This suits strong momentum stocks, which are covered in Momentum Breakouts.
Practical Example
Hypothetically, a stock breaks out above ₹610 and runs to ₹668 in four sessions. Its ATR is ₹16. Mohan sees it at ₹668, which is about 3.6 ATR above the breakout level, and decides not to chase.
Over the next six sessions, the stock forms a tight flag between ₹648 and ₹664, holding well above ₹610 on falling volume. Mohan places a buy-stop at ₹665 with a stop at ₹646, below the flag low, risking ₹19. It triggers, and the stock reaches ₹705 over the next two weeks, about 2.1R.
Chasing or Waiting? Our Test
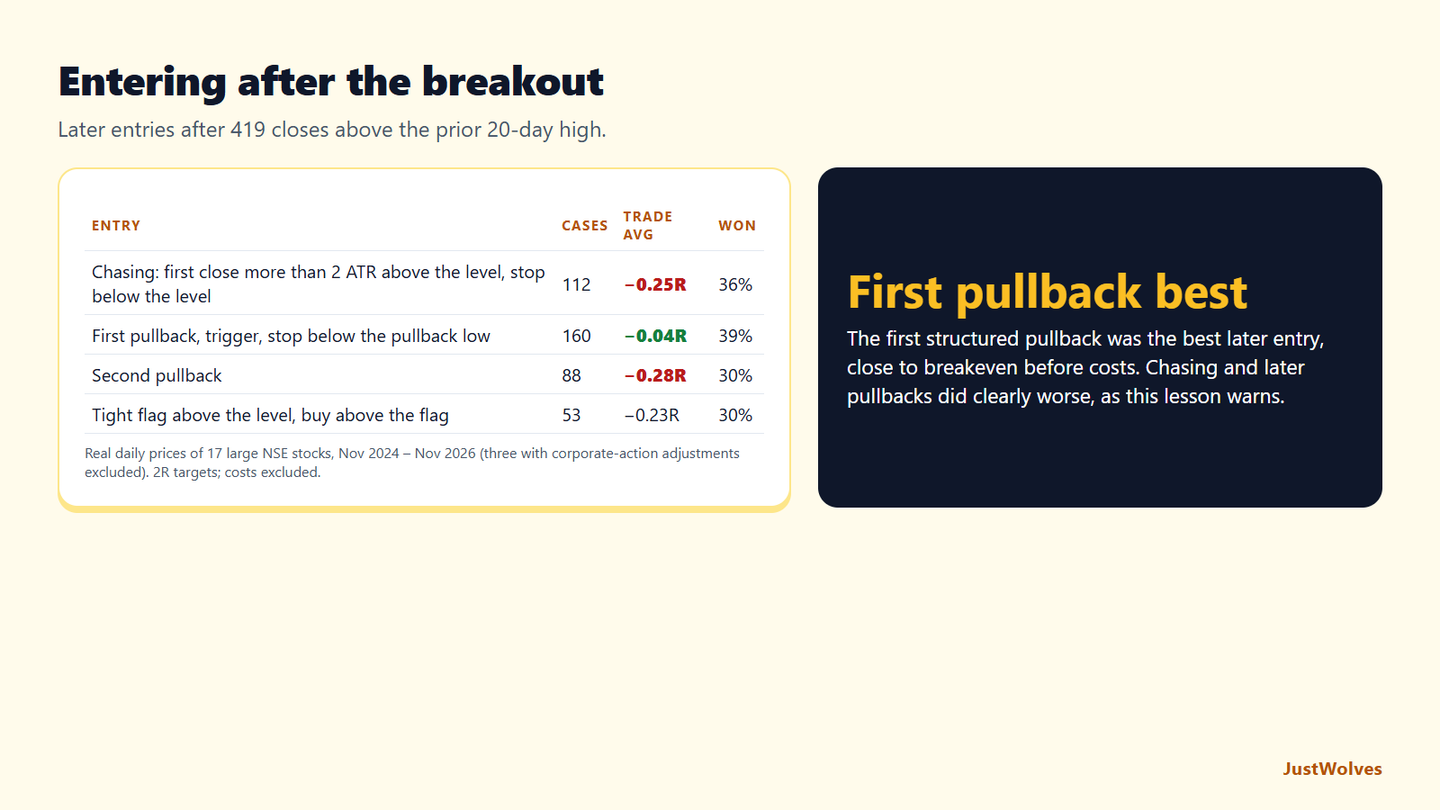
JustWolves tested this lesson's later entries on about two years of daily prices for 17 large NSE stocks (November 2024 to November 2026), after 419 closes above the prior 20-day high. Chasing: buying the first close more than 2 ATR above the level, with the stop back below the level. Pullbacks: after a down day, a close above the previous day's high while still above the level, with the stop below the pullback low; we recorded the first and the second such pullback separately. Flags: four days in a range under 1.5 ATR, all above the level, then a close above the flag's high. All trades used a 2R target.
| Entry | Cases | Trade average | Won |
|---|---|---|---|
| Chasing: first close more than 2 ATR above the level | 112 | −0.25R | 36% |
| First pullback, trigger, stop below the pullback low | 160 | −0.04R | 39% |
| Second pullback, same rules | 88 | −0.28R | 30% |
| Tight flag above the level, buy above the flag high | 53 | −0.23R | 30% |
Chasing did badly, as this lesson warns. Entries more than 2 ATR above the level averaged −0.25R. They won slightly more often than other entries, because the trend was already strong, but each loss was large relative to the gain because the stop was far away.
The first pullback was the best of the later entries. It averaged −0.04R, close to breakeven before costs and better than buying the breakout itself in this period. The second pullback did much worse, −0.28R, which supports the lesson's point that the first pullback after a breakout is more reliable than later ones.
Flags did not stand out here. Our mechanical flag definition, four tight days above the level, averaged −0.23R. Flags that look clean by eye may do better than a simple rule, but this test gives no reason to prefer them over the first pullback.
None of these entries was profitable on its own across this two-year window, which included two sharp market falls. The ranking is the useful part: if you miss a breakout, the first structured pullback is the entry to wait for, and chasing or buying later pullbacks costs you.
Common Mistakes
- Chasing extended moves with distant stops.
- Buying later pullbacks with the same confidence as the first.
- Using the MA entry after the average has flattened.
- Entering without a nearby invalidation point.
- Fear of missing out overriding the plan.
Professional Insight
Experienced traders often say a missed breakout is not a loss. Strong stocks usually offer several structured entries over the following weeks, and the traders who wait for them avoid the large losses that come from chasing. The ones who chase tend to buy near short-term tops. Keeping a watchlist of recent breakouts, and checking them each evening for new structure, turns missed trades into planned ones.
Risk Considerations
- Later entries have less of the move left.
- Momentum can end abruptly.
- Extended stocks are vulnerable to sharp pullbacks.
Important Terminology
| Term | Meaning |
|---|---|
| Extension | How far price is from the nearest level, often in ATR terms. |
| First pullback | The first pause after a breakout. |
| Flag | A tight, slightly sloping consolidation after a sharp move. |
| Dynamic support | A rising moving average acting as support. |
| FOMO | Fear of missing out. |
What should I do if I miss a breakout?
Wait for a structured entry: the first pullback, a flag above the level, or a test of a rising short-term average.
How far is too far to chase?
Many traders avoid entries more than about 1 to 1.5 ATR above the nearest level they can stop against.
What is a post-breakout flag?
A tight consolidation above the breakout level, offering an entry above its high and a stop below its low.
Which moving average works for strong breakouts?
Some traders use the rising 10 or 20-day average while momentum is strong.
Is the first pullback better than later ones?
Usually; later pullbacks in an older move tend to be less reliable.
Should I chase a breakout I missed?
Our NSE data says no. Buying more than 2 ATR above the breakout level, with a stop back below the level, averaged −0.25R per trade in our test on 17 stocks, worse than buying the breakout or waiting for the first pullback.
Is the first pullback after a breakout the best entry?
In our test it was the best later entry: first pullbacks averaged −0.04R per trade with a stop below the pullback low, against −0.28R for second pullbacks and −0.25R for chasing.
Practical Exercise
Find second chances.
Your task
Step 1: Find ten strong breakouts
That moved more than 3 ATR in a week.
Step 2: Mark later entries
First pullback, flag and MA test.
Step 3: Calculate R
For each entry, using its own stop.
Step 4: Compare
With chasing at the point of maximum extension.
Check Your Understanding
Chasing an extended breakout usually means:
Related Lessons
Previous: Breakout and Retest. Next module: Momentum Breakouts. See also Pullback Continuation Setups.