
Visible Reversal Zones
JustWolves is an educational platform and is not a SEBI-registered investment advisor. Trading financial instruments involves significant risk of loss and may not be suitable for all investors. Past performance is not indicative of future results. Read our full disclaimer →
What you'll learn
- A Visible Reversal Zone (VRZ) is a level on the higher timeframe where price clearly changed direction
- Mark zones on the higher timeframe (15-minute for 3-minute traders, 5-minute for 1-minute traders) and trade only when price reaches them
- A VRZ Low needs at least two candles on each side with higher lows; wait for the right-hand candles to close
- Keep at most three zones above and three below current price; merge zones that are very close together
- Fresh zones, not yet revisited, tend to give the cleanest reactions; each retest weakens a zone
In this article · 16 sections
A scalper who trades anywhere on the chart pays costs on every random move. Visible Reversal Zones narrow the job down: before trading, you mark the few levels on a higher timeframe where price clearly reversed, and you only look for trades when price returns to one of them. This lesson covers how to choose the timeframes, the rules for marking VRZ highs and lows, how many zones to keep, and why fresh zones matter most.
What You Will Learn
- What a Visible Reversal Zone is
- Which timeframes to mark and trade
- The rules for valid VRZ highs and lows
- How to keep the chart clean and prefer fresh zones
Before You Start
What a VRZ Is
A Visible Reversal Zone is a price level on the higher-timeframe chart where price clearly turned: up to a peak and down (a VRZ High), or down to a trough and up (a VRZ Low). It isn't derived from a formula; it's a reversal you can see at a glance.
That's the test: if you need to convince yourself a reversal happened there, it isn't a VRZ. Zones inside long, choppy sideways stretches don't count, because there's no clear point where control changed.
Timeframe Pairs
| Trading chart | Zone chart |
|---|---|
| 1-minute | 5-minute |
| 3-minute | 15-minute |
| 5-minute | 15 or 60-minute |
Mark zones before the session and update them as new reversals form. Don't go back too far: on intraday charts, the last few sessions are usually enough.
Rules for VRZ Highs
- A clear peak: price rose, stopped and turned down visibly.
- Signs of selling: often an upper wick or a bearish candle at the high.
- A meaningful decline afterwards, not a one-candle dip that immediately recovered.
- Merge close zones: if two highs are very close relative to the instrument's typical range, keep only the higher one.
Rules for VRZ Lows: The 2-Candle Rule
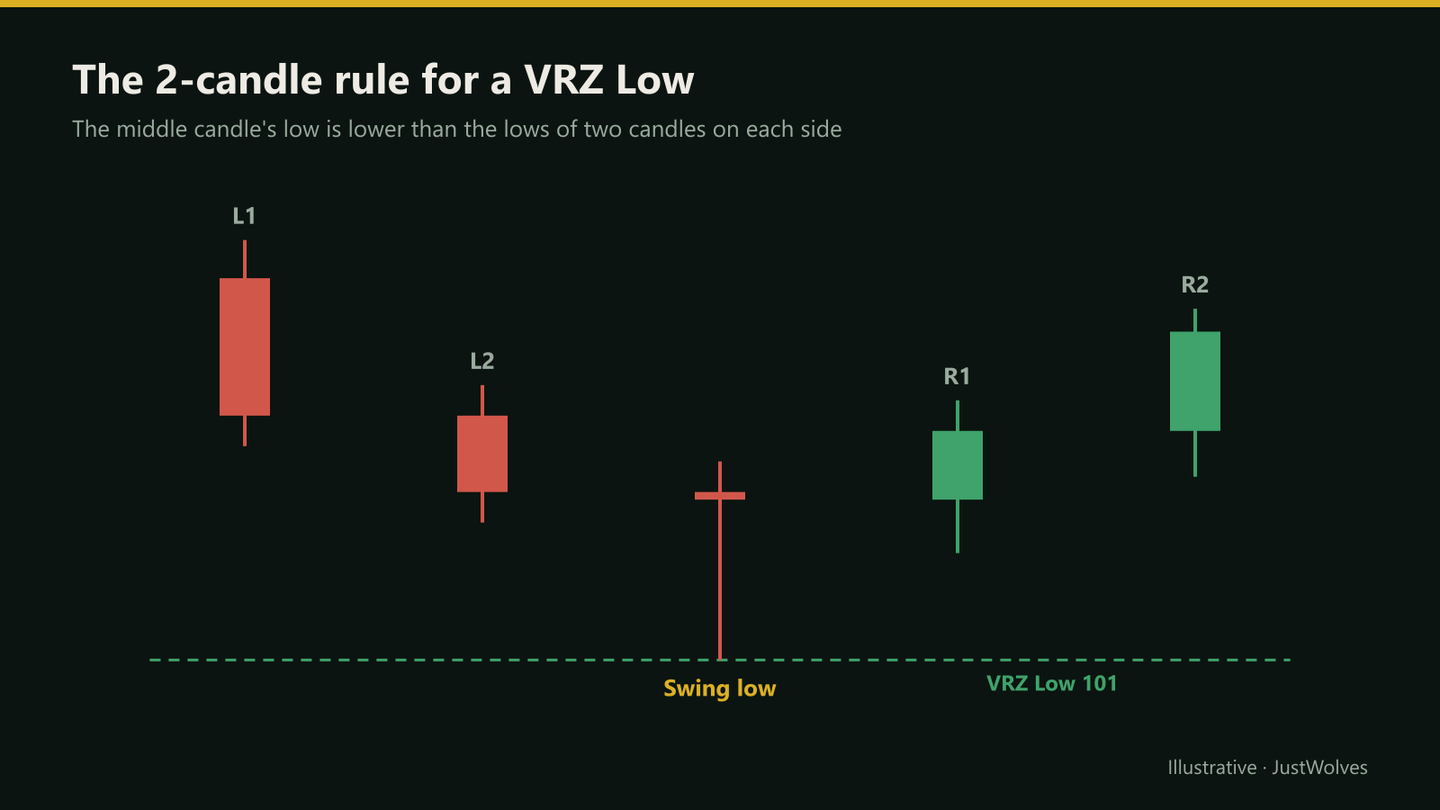
A candle's low qualifies as a VRZ Low only if it's the lowest point among at least five candles: at least two candles to its left with higher lows, and at least two candles to its right with higher lows. Candle colours don't matter; only the lows do.
Wait until both right-hand candles have closed before marking the zone. If only one has formed, the decline may continue and the 'low' would be invalid. The same structure, two candles on each side with lower highs, is a useful check for VRZ Highs too.
How Many Zones to Keep
Too many lines produce indecision: every small move reaches 'a zone'. A practical maximum is three VRZ Highs above current price and three VRZ Lows below, starting from the nearest and working outward. In practice you'll usually focus on the nearest one or two on each side.
When price breaks through a zone convincingly and holds beyond it, remove the zone from your active chart, or mark it as broken.
Fresh vs Traded Zones
A fresh zone hasn't been revisited since it formed. The first return to it tends to give the cleanest reaction, because the orders that caused the original reversal haven't yet been used up. A traded zone has already been revisited; each retest absorbs some of that interest, and a zone tested three or four times is increasingly likely to break.
When choosing between zones, prefer fresh ones, and treat repeatedly tested zones with more caution.
Real Prices: A Fresh Test and a Second Test
Meera's example in this lesson is hypothetical. The chart below shows a VRZ Low on real NIFTY 50 15-minute prices from 2 November 2026: marked by the five-candle rule, holding cleanly on its first return, and breaking on its second.
Real prices: a VRZ Low that held on its first test and broke on its second, NIFTY 50, 2 November 2026
Step 1 of 4
Marking the zones
On 2 November 2026, NIFTY 50's 10:15 candle sets a low of 23,287.3, with two higher lows on each side: a VRZ Low by this lesson's five-candle rule. The 10:45 high of 23,360.2, with lower highs on each side, is a VRZ High. ATR on this chart is about 41 points.
- What to observe
- Two clear, fresh zones about 73 points apart.
- Condition
- Now wait for price to return.
Practical Example
Hypothetically, on a liquid large-cap stock's 15-minute chart, Meera marks a fresh VRZ Low at ₹1,482 (two candles each side with higher lows) and the nearest VRZ High at ₹1,496. At 10:40, price falls to ₹1,483. On her 3-minute chart, a bullish candle closes at ₹1,485 after a long lower wick.
She buys 300 shares at ₹1,485 with a stop at ₹1,479.50, below the zone, risking ₹5.50 a share (₹1,650). Her target is the VRZ High at ₹1,496, ₹11 away (₹3,300). Using the brokerage calculator, charges are about ₹206 on the win and ₹205 on a loss, so the net outcome is about +₹3,094 or −₹1,855, roughly 1.7R after costs.
Do Fresh Zones Hold More Often? Our Test
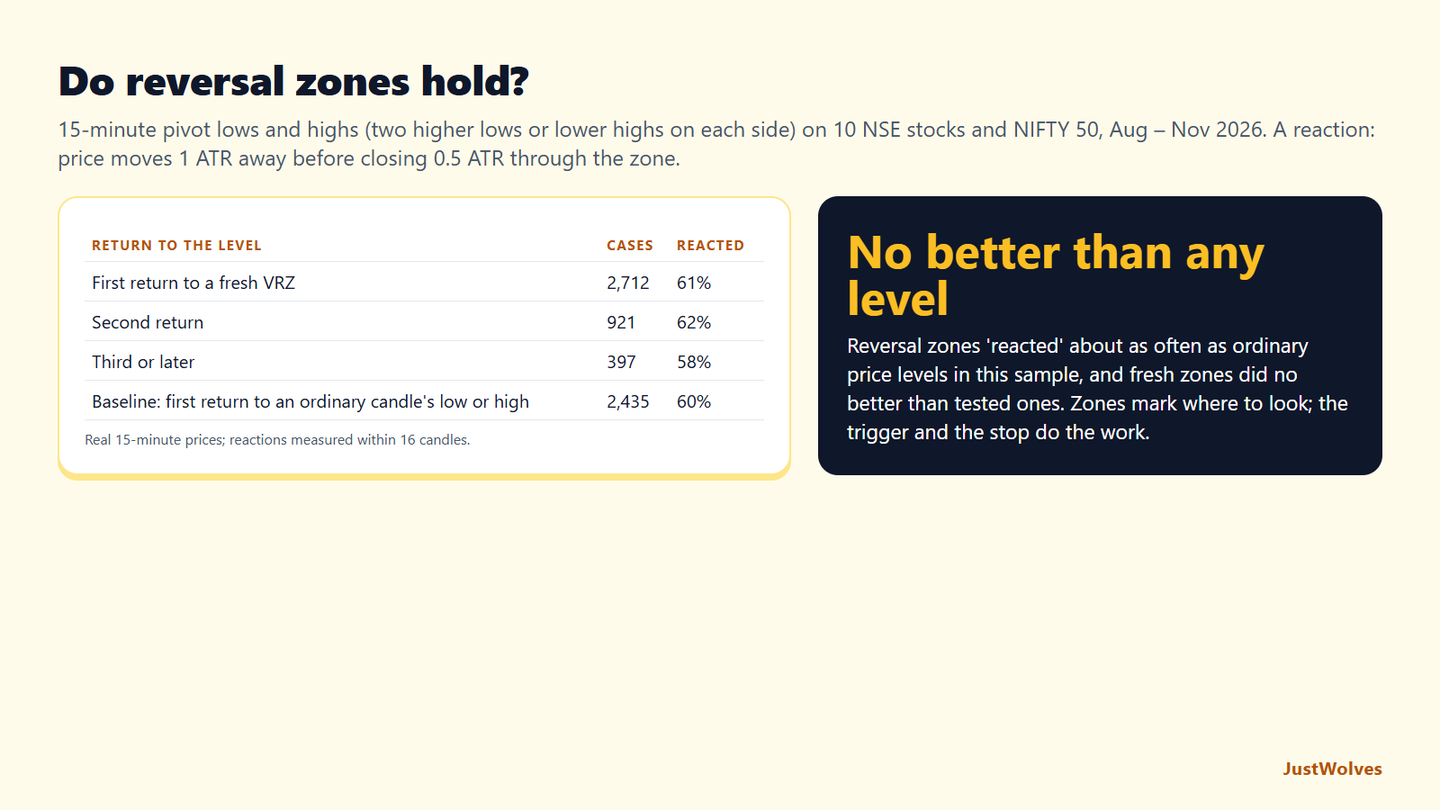
JustWolves tested this lesson's zone rules on 15-minute prices for 10 liquid NSE stocks and NIFTY 50, August to November 2026. Every VRZ Low and High was marked by the five-candle rule (two higher lows, or lower highs, on each side). We then followed each zone for up to five sessions and counted each return, after price had first moved at least 1 ATR away. A reaction meant price moved 1 ATR away from the zone before closing half an ATR through it. As a baseline, we ran the same test on the lows and highs of ordinary candles that were not pivots.
| Return to the level | Cases | Reacted 1 ATR before closing 0.5 ATR through |
|---|---|---|
| First return to a fresh VRZ | 2,712 | 61% |
| Second return | 921 | 62% |
| Third or later return | 397 | 58% |
| Baseline: first return to an ordinary candle's low or high | 2,435 | 60% |
Zones reacted often, but so did ordinary levels. About 61% of first returns to a fresh VRZ produced a 1-ATR move away before breaking, which sounds useful until it is compared with the baseline: the low or high of any ordinary candle reacted 60% of the time under the same test. Short-term price is noisy enough that most levels see a bounce of that size at some point.
Fresh zones were not stronger here. Second returns reacted as often as first ones, and only third or later returns were slightly weaker. That runs against this lesson's idea that the first return gives the cleanest reaction, at least as measured mechanically on these timeframes.
What this means for the method. The value of VRZs is the one this lesson's callout describes: they tell you where to look, keeping you out of the middle of nowhere and reducing the number of trades. The trade itself has to come from a trigger on the lower timeframe and a stop beyond the zone. Our test measured only the level, not the trigger, so a trader's results depend heavily on that second step and on costs.
Common Mistakes
- Marking zones on the trading timeframe instead of the higher one.
- Marking VRZ Lows before two right-hand candles have closed.
- Too many lines on the chart.
- Treating heavily tested zones like fresh ones.
- Entering at the zone without a trigger.
Professional Insight
Experienced scalpers often spend more time preparing zones before the open than trading during the session. A clean chart with a handful of fresh zones means most of the session is spent waiting, which is exactly the point: fewer, better-located trades pay fewer costs and suffer fewer random losses.
Risk Considerations
- Zones can break without reacting.
- News can move price through zones instantly.
- Tight stops beyond zones can be hit by noise.
Important Terminology
| Term | Meaning |
|---|---|
| VRZ | Visible Reversal Zone: a level where price clearly reversed. |
| VRZ High | A clear peak where price turned down. |
| VRZ Low | A clear trough where price turned up, confirmed by the 2-candle rule. |
| Fresh zone | A zone not yet revisited since it formed. |
| Traded zone | A zone already revisited at least once. |
What is a Visible Reversal Zone?
A level on the higher-timeframe chart where price clearly reversed direction, used as a place to look for scalping trades.
What is the 2-candle rule?
A swing low counts only if at least two candles on each side have higher lows, with the right-hand candles already closed.
Which timeframe should I mark zones on?
One higher than your trading chart: 15-minute for 3-minute trading, 5-minute for 1-minute trading.
How many zones should I mark?
A practical maximum is three above and three below current price.
Why are fresh zones better?
The interest that caused the original reversal hasn't been used up by earlier retests.
Do fresh reversal zones hold better than tested ones?
Not in our test. On 15-minute prices of 10 NSE stocks and NIFTY 50, first returns to a fresh zone reacted 61% of the time, second returns 62%, and third or later returns 58%.
Are reversal zones better than random price levels?
Only marginally in our data. Ordinary candle lows and highs, tested the same way, reacted on 60% of first returns, against 61% for fresh reversal zones. The zone narrows where you look; the trigger and the stop decide the trade.
Practical Exercise
Mark and test zones.
Your task
Step 1: Pick two liquid stocks
Or Nifty futures.
Step 2: Mark VRZs before the open
On the 15-minute chart, max three each side.
Step 3: Watch reactions
Record what happened at each zone on first and later touches.
Step 4: Compare
Did fresh zones react better than traded ones?
Check Your Understanding
A 3-minute scalper marks zones on:
Related Lessons
Previous module: RSI and Momentum Scalping. Next: Range, Breakout and Pullback Scalping. See also How to Draw Support and Resistance Levels Correctly.