
Session-Based Scalping: First Candle Range + FVG
JustWolves is an educational platform and is not a SEBI-registered investment advisor. Trading financial instruments involves significant risk of loss and may not be suitable for all investors. Past performance is not indicative of future results. Read our full disclaimer →
What you'll learn
- The range is the high and low of the first 5-minute candle, 9:15 to 9:20 am IST
- A valid breakout needs a 1-minute candle body to close outside the range, followed by a fair value gap beyond it
- Entry is at the close of the FVG's third candle; the stop is at the first candle that closed outside the range
- The target is a fixed 2:1 reward-to-risk, measured before costs
- On one Nifty futures lot, 14 points of costs can cut a 2:1 trade to under 1:1; check the net numbers or use options
In this article · 15 sections
This method turns the opening range idea into a strict, mechanical scalp. It uses one candle to define the battleground, a fair value gap to confirm that a breakout has force behind it, and fixed rules for the entry, stop and target. Because every decision is pre-set, it's easy to test. This lesson sets out the rules for Indian markets, the fake-out filters, and the cost check that decides whether a given setup is worth taking.
What You Will Learn
- How to mark the first candle range
- What counts as a valid breakout
- The entry, stop and target rules
- Filtering fake-outs and checking costs
Before You Start
Step 1: Mark the First Candle
Open a 5-minute chart of Nifty (futures, or the index for reference) before 9:15 am. Wait for the first candle, 9:15 to 9:20, to close. Then draw two horizontal lines at its high and low. Don't draw them before the candle closes; the levels can still change.
Switch to the 1-minute chart. These two lines are the only levels this method uses for the session's first trade.
Step 2: A Body Close and an FVG
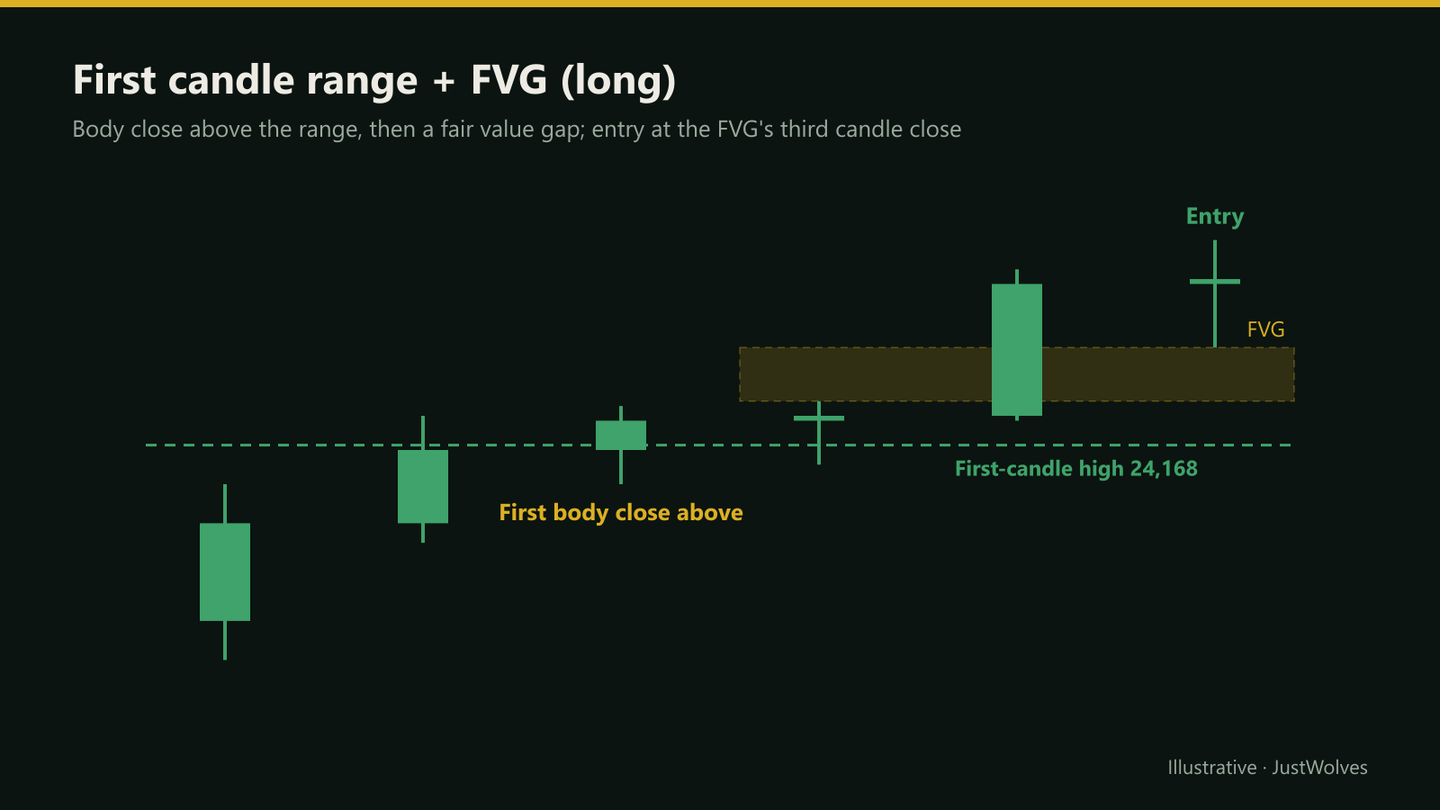
A wick through the range isn't a breakout. The method requires two things on the 1-minute chart: first, a candle whose body closes outside the range; then, a fair value gap forming beyond the range, a three-candle pattern where the third candle's low is above the first candle's high (bullish) or the third candle's high is below the first candle's low (bearish).
The body close shows commitment; the FVG shows that the move had enough force to leave an imbalance. Together they filter out most of the pokes that reverse straight back into the range.
Step 3: Entry, Stop and Target
| Element | Rule |
|---|---|
| Entry | At the close of the FVG's third candle |
| Stop | At the low (long) or high (short) of the first candle that closed its body outside the range, not the FVG candle |
| Target | Twice the stop distance from entry (2:1 before costs) |
| No setup | If no body close plus FVG appears, no trade |
The stop rule matters: the first candle to close outside the range marks the committed breakout. If price returns below it, the breakout has failed. Placing the stop at the FVG candle instead usually makes it too tight; placing it at the far side of the range usually makes it too wide.
Real Prices: The Rules on One Morning
The example in this lesson is hypothetical. The chart below applies the three steps to real NIFTY 50 1-minute prices from 2 November 2026: the first candle range, a body close outside it, a fair value gap beyond it, and a fixed stop and target.
Real prices: the first candle range and a 1-minute FVG entry, NIFTY 50, 2 November 2026
Step 1 of 4
Step 1: the first candle
NIFTY 50's first 5-minute candle on 2 November 2026, 9:15 to 9:20, runs from 23,212.7 to 23,292.4: an 80-point range. The lines go on the chart only after it closes.
- What to observe
- This lesson's battleground for the session.
- Condition
- Now switch to the 1-minute chart.
Fake-Outs and Choppy Days
- Wick fake-out: price pokes through but no body closes outside. No trade.
- Close without FVG: a body closes outside, but no gap forms. Treat as weak; no trade.
- FVG that immediately fills back into the range: the breakout lacks force; many traders skip the session.
- Wide first candle: a very large first candle (for example, on a big gap day) makes stops and targets unrealistic. Some traders set a maximum range width.
The Cost Check
The fixed 2:1 is measured before costs. On one Nifty futures lot, round-trip costs are about 14 points. With a 25-point stop and a 50-point target, the net trade becomes about 36 points of reward against 39 of risk, slightly worse than 1:1.
So the method suits either larger stop distances, where 14 points is a small fraction, or execution through near-the-money options, where costs are about 1 premium point per lot. Do this check on every setup, not just once.
Practical Example
Hypothetically, Nifty's first 5-minute candle ranges from 24,132 to 24,168. At 9:31, a 1-minute candle closes at 24,170.5, with a low of 24,164: the first body close above the range. Two candles later an FVG forms, and its third candle closes at 24,185. In index terms, entry is 24,185, the stop is 24,164 (21 points) and the target is 24,227 (42 points).
Asha executes through one lot of an at-the-money call bought at 160. With a delta of about 0.5, the index stop and target translate to roughly 10.5 and 21 premium points, so she sets the option stop at 149.5 and the target at 181. Charges from the brokerage calculator are about ₹74 on a win and ₹71 on a loss: net, about +₹1,291 or −₹753, roughly 1.7R.
The Exact Rules, Tested
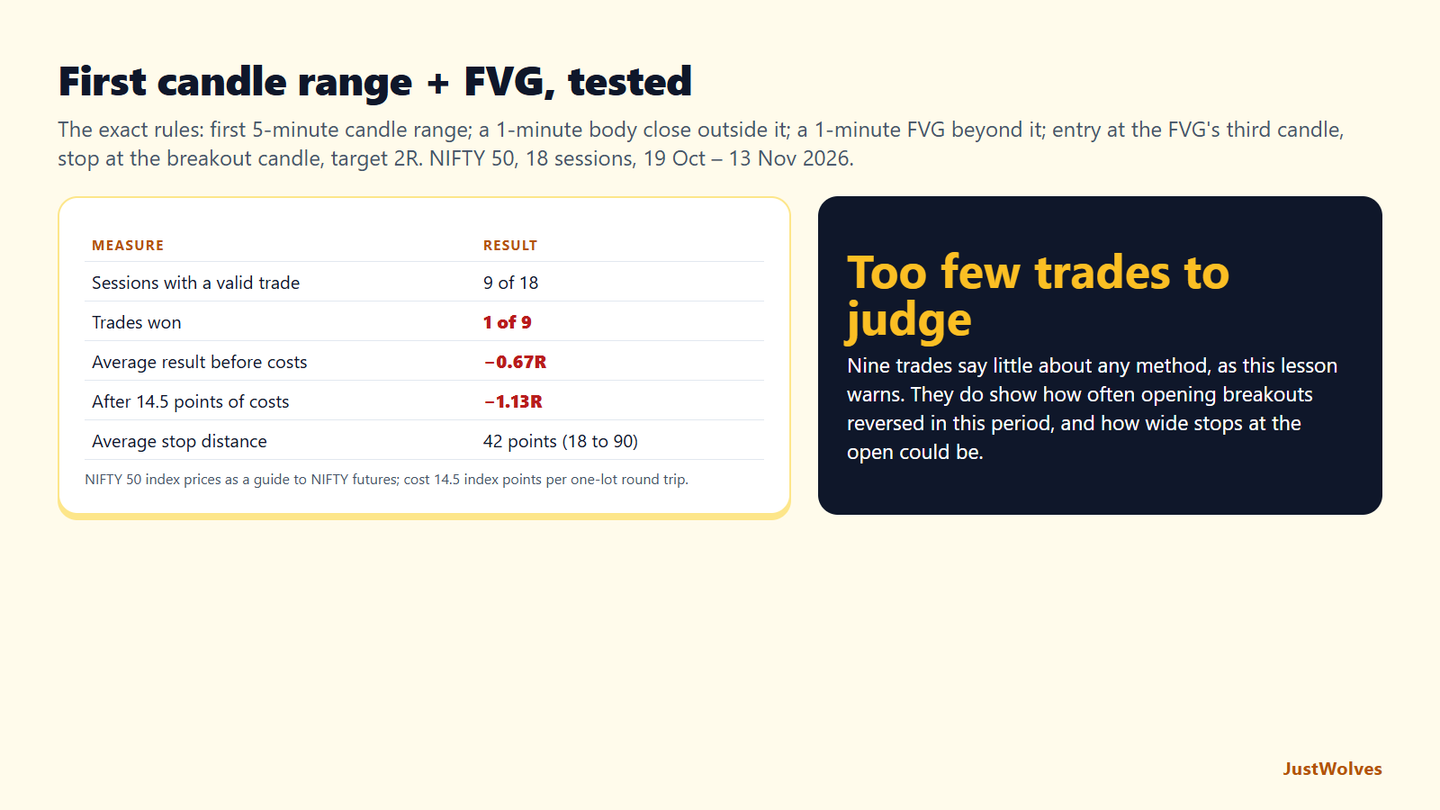
Because this method is fully mechanical, it can be tested exactly as written. JustWolves ran it on NIFTY 50 1-minute prices for the 18 sessions available, 19 October to 13 November 2026: the first 5-minute candle's range; the first 1-minute candle whose body closed outside it; a 1-minute FVG forming beyond the range within the next 15 minutes; entry at the FVG's third candle; stop at the breakout candle's low (or high); target 2R; one trade a day, none after 2:30 pm. Costs: 14.5 index points per one-lot futures round trip.
| Measure | Result |
|---|---|
| Sessions with a valid trade | 9 of 18 |
| Trades won (2R target) | 1 of 9 |
| Average result before costs | −0.67R |
| Average after 14.5 points of costs | −1.13R |
| Stop distance | 18 to 90 points, average 42 |
Half the sessions produced no trade. That matches this lesson's tip: no setup is a result. On those nine days, the method cost nothing.
On the other nine, eight trades lost. The breakout candle was followed by an FVG, as required, but price then returned through the breakout candle's low or high before reaching 2R. In this short window, most moves out of the first candle's range reversed within the session, which is consistent with our wider finding that NIFTY closed back inside its opening range on about half of breakout days.
Stops varied widely. The breakout candle's extreme sat anywhere from 18 to 90 points from the entry. On the tight ones, the 14.5-point cost was most of an R; on the wide ones, a single loss was large. The cost check in this lesson exists for exactly this reason: a setup whose stop makes costs a large fraction of the risk is not worth taking.
Nine trades prove nothing either way, as this lesson's professional insight says about short track records. The value of a mechanical method is that you can keep testing it honestly over months. Ours is a starting record, not a verdict.
Common Mistakes
- Drawing levels before 9:20.
- Entering on wicks or body closes without an FVG.
- Stops at the FVG candle instead of the first close outside.
- Ignoring costs on futures.
- Trading the setup repeatedly through the session.
Professional Insight
Mechanical methods like this are valuable mainly because they can be tested honestly. Experienced traders who use them record every session, including the ones with no setup, and evaluate the method over months, not days. Results claimed from a few weeks of trades, by anyone, say very little about how a method will perform.
Risk Considerations
- Opening volatility and slippage.
- Gap days with very wide first candles.
- Costs that change the net reward-to-risk.
Important Terminology
| Term | Meaning |
|---|---|
| First candle range | High and low of the 9:15–9:20 five-minute candle. |
| Body close | A candle whose open-to-close body is outside the range. |
| Fair value gap | A three-candle imbalance left by a strong middle candle. |
| Fake-out | A move outside the range that quickly reverses. |
| Delta | How much an option's premium moves per point of the underlying. |
What is the first candle range strategy?
A scalp that marks the first 5-minute candle's high and low and trades a committed breakout of that range.
Why wait for a fair value gap?
It shows the breakout had enough force to leave an imbalance, which filters many fake-outs.
Where is the stop?
At the low (for longs) or high (for shorts) of the first candle that closed its body outside the range.
Does the 2:1 target include costs?
No. Costs reduce the net ratio, especially on Nifty futures, where a round trip costs about 14 points per lot.
What if there's no setup?
Don't trade. A session without a valid setup is a normal outcome.
How often does the first candle range method give a trade?
In our 18-session NIFTY 50 test, the exact rules (a 1-minute body close outside the first 5-minute candle, then an FVG beyond it) produced a valid trade on 9 sessions, about half.
Is the first candle FVG strategy profitable?
We cannot say from our data. Over 18 sessions in October and November 2026, only 1 of 9 trades reached its 2R target, averaging −1.13R after costs, but nine trades are far too few to judge any method.
Practical Exercise
Test it honestly.
Your task
Step 1: Record 40 sessions
First candle range, whether a valid setup formed, and the outcome.
Step 2: Include no-setup days
And setups you would have skipped.
Step 3: Apply costs
Both as futures and as at-the-money options.
Step 4: Compare
Net expectancy for each execution method.
Check Your Understanding
The first candle range covers:
Related Lessons
Previous: SMC Scalping. Next: Nifty Intraday Key Levels: The Premium Open Method. See also Opening Range Breakout (ORB).