
RSI and Momentum Scalping
JustWolves is an educational platform and is not a SEBI-registered investment advisor. Trading financial instruments involves significant risk of loss and may not be suitable for all investors. Past performance is not indicative of future results. Read our full disclaimer →
What you'll learn
- On short timeframes, RSI is noisy; most intraday traders use it as a momentum filter, not a signal generator
- RSI above 50 shows short-term momentum is up; below 50, down
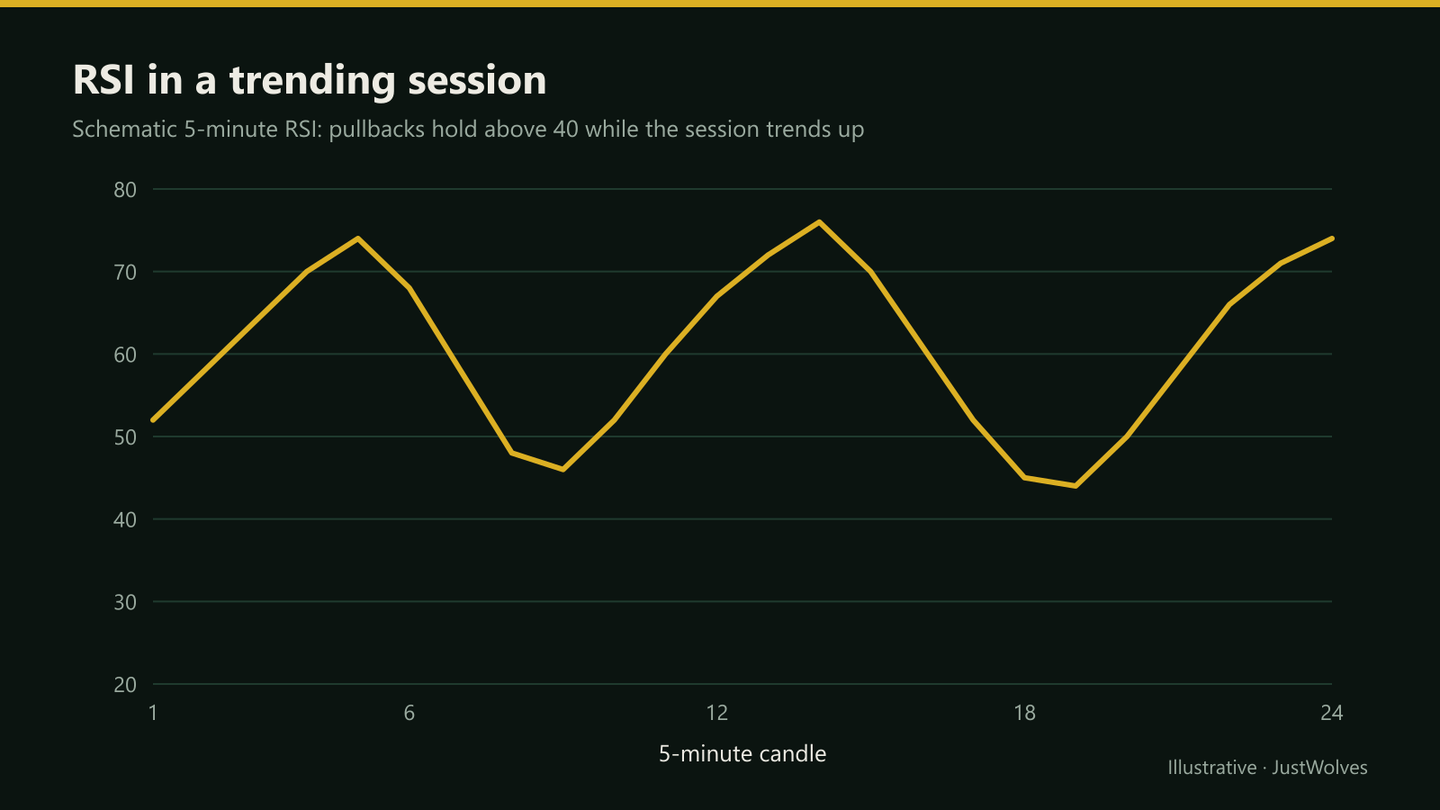
- In a trending session, intraday RSI pullbacks often hold around 40–50 in uptrends and 50–60 in downtrends
- Overbought and oversold readings persist in strong intraday moves; fading them is risky
- RSI works best combined with structure and a session filter such as VWAP
In this article · 15 sections
Momentum is central to scalping: a scalper wants to be in the market only while price is moving with some force. RSI is the most common way traders measure that momentum on short charts. It's also easy to misuse, especially on 1-minute charts where it swings between extremes all day. This lesson covers practical RSI settings for intraday charts, how to use the 50 line and trend ranges, and how to combine RSI with VWAP and structure.
What You Will Learn
- How RSI behaves on short timeframes
- Using the 50 line as a momentum filter
- RSI ranges in trending sessions
- Combining RSI with VWAP and structure
Before You Start
Read VWAP for Intraday Traders. RSI and MACD for Swing Traders explains how RSI is calculated.
RSI on Short Timeframes
RSI compares recent gains and losses over a set number of periods, usually 14, on a 0–100 scale. On a daily chart, 14 periods is about three weeks; on a 5-minute chart, it's 70 minutes; on a 1-minute chart, just 14 minutes.
That makes intraday RSI much more reactive. On a 1-minute chart, it can move from 30 to 70 in a few candles. Some traders shorten the setting to 7 or 9 for even faster signals, but that adds noise. Many prefer the standard 14 on a 5-minute chart, using lower timeframes only for entry timing.
The 50 Line as a Filter
RSI above 50 means recent gains have outweighed recent losses: short-term momentum is up. Below 50, it's down. A simple filter: take long scalps only when 5-minute RSI is above 50, and short scalps only when it's below.
This filter is crude, but it stops one of the most common scalping mistakes: buying dips while short-term momentum is clearly falling.
RSI Ranges in Trending Sessions
| Session type | Common RSI range | Pullbacks often hold near |
|---|---|---|
| Strong up session | 40–80 | 40–50 |
| Strong down session | 20–60 | 50–60 |
| Range-bound session | Swings around 50, 35–65 | No reliable level |
These are tendencies, not thresholds. Their value is in reading context: an up session where RSI pullbacks start breaking below 40 is losing momentum, even if price is still above VWAP.
Overbought Isn't a Short Signal
On trending days, RSI can stay above 70 for long stretches. Shorting because RSI is 'overbought' fights the strongest part of the move. Similarly, buying because RSI is 'oversold' on a falling day often catches a falling market.
Extreme readings are more useful at clear intraday levels after an extended move, combined with a sign of rejection. Even then, many scalpers prefer to wait for structure to change rather than fade momentum.
Real Prices: Oversold All Morning
This lesson warns against buying because RSI is oversold on a falling day. The chart below shows why, on real Reliance Industries prices from 8 October 2026: RSI below 30 again and again, and the stock lower each time.
Real prices: "oversold" all morning while the stock kept falling, Reliance Industries, 8 October 2026
Step 1 of 4
The first "oversold" reading
Reliance opens at ₹1,207.7 on 8 October 2026 and falls below VWAP within minutes. At 9:35, 5-minute RSI drops to 28 with the stock at ₹1,199.2. A trader who buys "because it is oversold", with a stop one ATR away (about ₹1.9), is stopped out on the next candle as the stock falls to ₹1,195.5.
- What to observe
- This lesson's warning: oversold on a falling day often catches a falling market.
- Condition
- RSI is measuring a strong move, not predicting a turn.
Combining RSI, VWAP and Structure
A momentum scalp checklist (long)
Step 1: Session filter
Price above a rising VWAP on 5-minute Nifty futures.
Step 2: Momentum filter
5-minute RSI above 50, with recent pullbacks holding above 40.
Step 3: Setup
A pullback to a level: VWAP, a prior breakout level or the previous day's high.
Step 4: Trigger
1-minute break of structure upward as RSI turns back up.
Step 5: Stop and target
Below the pullback low; target the session high or a fixed multiple of risk, after costs.
Practical Example
Hypothetically, on a trending morning, Nifty futures are above a rising VWAP and 5-minute RSI has held above 45 on two pullbacks. At 11:05, price pulls back to the previous day's high at 24,310, and RSI dips to 47. A 1-minute candle breaks the last lower high as RSI turns up.
Pranav buys a near-the-money call at 142 with a stop at 133, based on the option's price at the index pullback low, risking 9 premium points. He targets 160, 18 points away. Charges of about 1 point per lot make the net reward about 17 points against about 10 of risk, roughly 1.7R.
What Did RSI Extremes Lead To? Our Test
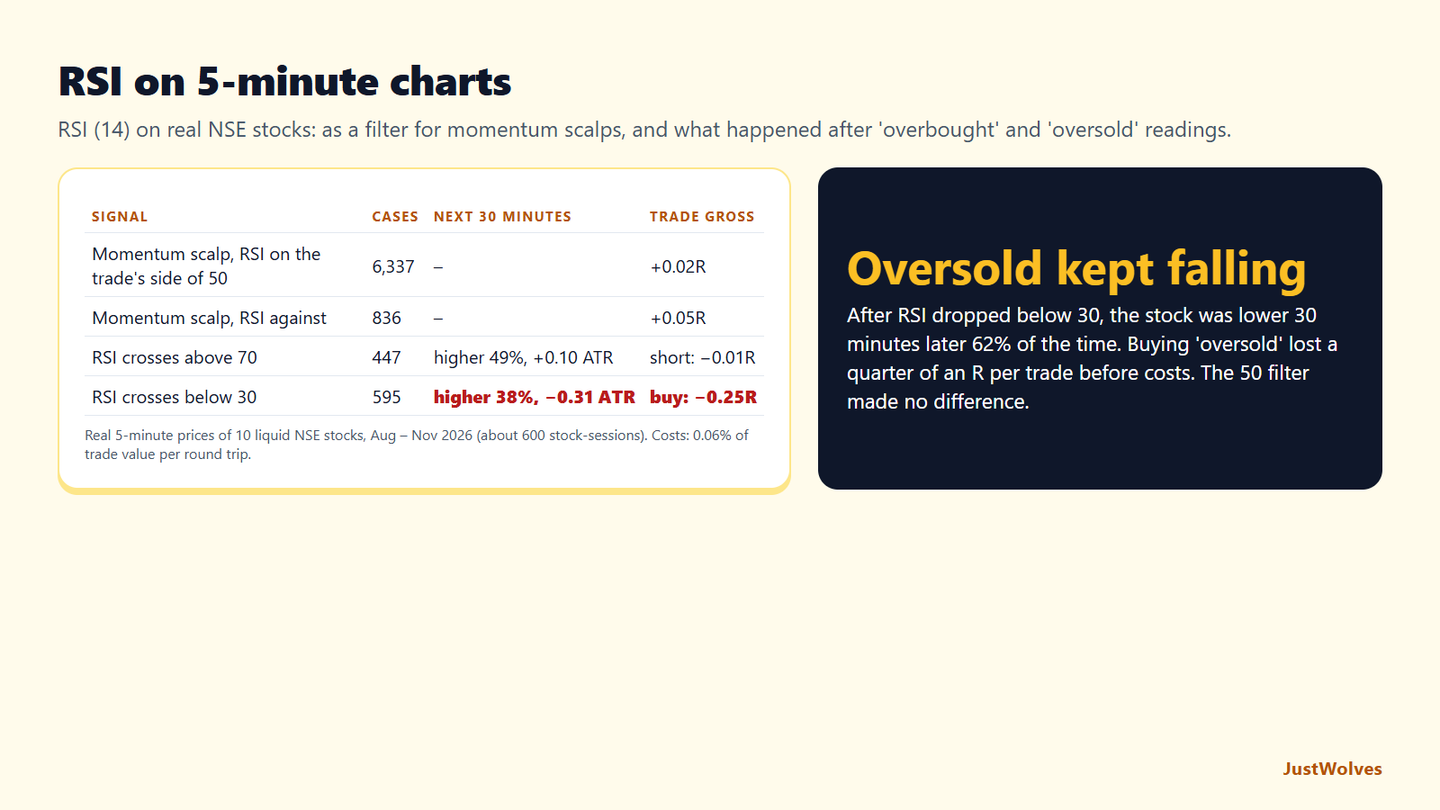
JustWolves tested 14-period RSI on 5-minute prices for 10 liquid NSE stocks, about 58 sessions each from August to November 2026. We used RSI as a filter on a simple momentum scalp (a close beyond the previous 30 minutes' range, stop 1 ATR, target 1.5R), and we recorded what happened in the 30 minutes after every cross above 70 and below 30. We also tested fading those extremes: shorting a cross above 70 and buying a cross below 30, with the same stop and target.
| Signal | Cases | 30 minutes later | Fading it (gross) |
|---|---|---|---|
| RSI crosses above 70 | 447 | Higher 49%, average +0.10 ATR | Short: −0.01R |
| RSI crosses below 30 | 595 | Higher 38%, average −0.31 ATR | Buy: −0.25R |
| Momentum scalp | Trades | Gross | After costs |
|---|---|---|---|
| RSI on the trade's side of 50 | 6,337 | +0.02R | −0.37R |
| RSI against | 836 | +0.05R | −0.29R |
Oversold was a trap, as this lesson warns. After 5-minute RSI fell below 30, the stock was lower 30 minutes later 62% of the time, and buying the signal lost a quarter of an R per trade before costs. The low RSI was measuring a strong down move, and strong moves tended to continue over the next half hour.
Overbought was neutral. After crosses above 70, stocks were higher half the time, and shorting them broke even before costs, which also lost after costs. Neither extreme was a reliable reversal signal on its own.
The 50 filter did not help here. Momentum scalps with RSI on their side of 50 did no better than those against it, because the breakout itself already captured the momentum. This supports the callout in this lesson: one momentum measure is enough, and adding another rarely adds information.
What RSI did show well is the professional insight in this lesson: whether momentum is present. A stock holding in the 20 to 40 zone, like Reliance above, is trending, and the trade is with that trend, not against the extreme.
Common Mistakes
- Using 1-minute RSI signals alone.
- Shorting 'overbought' on trending days.
- Stacking several oscillators.
- Ignoring session context such as VWAP.
- Optimising RSI settings to fit a few past days.
Professional Insight
Experienced scalpers often say momentum tells them when not to trade. When RSI hovers around 50 and price keeps crossing VWAP, there's no momentum to scalp, and they wait. Their best sessions tend to be the ones where momentum is clear early, and their worst are the ones where they forced trades in its absence.
Risk Considerations
- Short-timeframe RSI gives many false signals.
- Momentum can reverse abruptly on news.
- Option premiums also change with time decay and volatility.
Important Terminology
| Term | Meaning |
|---|---|
| RSI | Relative Strength Index, a 0–100 momentum oscillator. |
| Momentum filter | A rule allowing trades only when momentum agrees. |
| RSI range shift | RSI's normal range moving up in uptrends and down in downtrends. |
| Overbought | A high RSI reading, traditionally above 70. |
| Break of structure | Price breaking the last swing that defined the move. |
What RSI setting is best for scalping?
Many traders use the standard 14 on a 5-minute chart and time entries on 1-minute charts. Shorter settings add noise.
Is RSI good for intraday trading?
As a momentum filter, yes. As a stand-alone signal on short charts, it gives many false signals.
Should I sell when intraday RSI is above 70?
Not on that alone; in trending sessions RSI can stay above 70 for long periods.
How do I combine RSI and VWAP?
Use VWAP for session direction and RSI to confirm momentum agrees, then enter at a level with a structural trigger.
What does RSI above 50 mean?
Recent gains outweigh recent losses: short-term momentum is up.
Should I buy when 5-minute RSI is oversold?
Not on its own, according to our test. Across 595 cases on 10 NSE stocks, after 5-minute RSI crossed below 30 the stock was lower 30 minutes later 62% of the time, and buying the signal averaged −0.25R per trade before costs.
Does the RSI 50 line improve scalping entries?
Not in our NSE test. Momentum scalps with 5-minute RSI on their side of 50 averaged +0.02R before costs, against +0.05R for those with RSI on the other side. The breakout signal already reflected the momentum.
Practical Exercise
Read momentum by session.
Your task
Step 1: Add RSI (14)
To a 5-minute Nifty futures chart with VWAP.
Step 2: Classify ten sessions
Trending up, trending down or range.
Step 3: Record RSI pullback lows
In trending sessions.
Step 4: Note when momentum failed
Did RSI warn before price did?
Check Your Understanding
RSI 14 on a 5-minute chart covers about:
Related Lessons
Previous: VWAP for Intraday Traders. Next module: Visible Reversal Zones. See also RSI and MACD for Swing Traders.