
Sessions and Timeframes: 1-, 3- and 5-Minute Charts
JustWolves is an educational platform and is not a SEBI-registered investment advisor. Trading financial instruments involves significant risk of loss and may not be suitable for all investors. Past performance is not indicative of future results. Read our full disclaimer →
What you'll learn
- NSE's continuous session runs from 9:15 am to 3:30 pm IST; activity is usually highest near the open and close
- Many intraday traders divide the day into an opening phase, a midday lull and a closing phase
- Lower timeframes show more detail but more noise; higher ones show structure but react later
- A common setup: 15-minute for context, 5-minute for setups, 1 or 3-minute for entries
- Fix your timeframes in advance; switching charts to justify a trade is a common error
In this article · 14 sections
Intraday traders work inside a six-and-a-quarter-hour window, and that window isn't uniform. The first hour after 9:15 behaves differently from the quiet stretch around lunch, and the last hour has its own character. Within the day, the timeframe you choose changes what you see: a 1-minute chart shows every wiggle, a 15-minute chart shows the structure. This lesson covers both: how the Indian session is structured, and how to combine short timeframes without drowning in noise.
What You Will Learn
- The structure of the Indian trading session
- How activity typically changes through the day
- What each short timeframe is good for
- A practical multi-timeframe setup for day trading
Before You Start
Read Execution Speed and Transaction Costs. The Multi-Timeframe Swing Analysis lesson explains the top-down principle on longer timeframes.
The Indian Trading Day
| Time | Phase | What usually happens |
|---|---|---|
| 9:00–9:15 | Pre-open (cash market) | Opening prices discovered; no continuous trading |
| 9:15–10:15 | Opening phase | Overnight news and global cues absorbed; wide ranges, high volume |
| 10:15–13:30 | Midday | Often quieter; ranges narrow, more choppy price action |
| 13:30–14:30 | Early afternoon | Activity often picks up as European markets trade |
| 14:30–15:30 | Closing phase | Higher volume; positions squared off; sharp moves possible on expiry days |
These phases describe common tendencies, not rules. Event days, such as RBI policy announcements or the Union Budget, can make any part of the session volatile.
Why Phases Matter
Many intraday setups work better in some phases than others. Breakout and momentum setups often do best in the opening phase, when volume and range are highest. Range and mean-reversion setups may suit the midday period, when ranges narrow. Many scalpers trade mainly in the first and last parts of the session and stay out of the midday lull, when choppy price action can produce many small losses.
Your own records are the best guide. Tag every trade with its time and compare results by phase after a few weeks.
Real Prices: One Day, Three Phases
The phases in this lesson's table are tendencies. The chart below shows them on real NIFTY 50 prices on 26 October 2026: a wide, fast opening that set the day's low, a long midday drift, and a closing phase that set the day's high.
Real prices: the phases of one trading day, NIFTY 50, 26 October 2026
Step 1 of 4
The opening phase
NIFTY 50 opens on 26 October 2026 at 22,524.4, below the previous close of 22,600, and falls to 22,387.4 within the first 15 minutes. That first candle spans 137 points, more than a third of the whole day's range.
- What to observe
- The day's low is set in the first 15 minutes.
- Condition
- In our 3-year data, the first hour set the day's high or low on 77% of days.
Choosing Timeframes
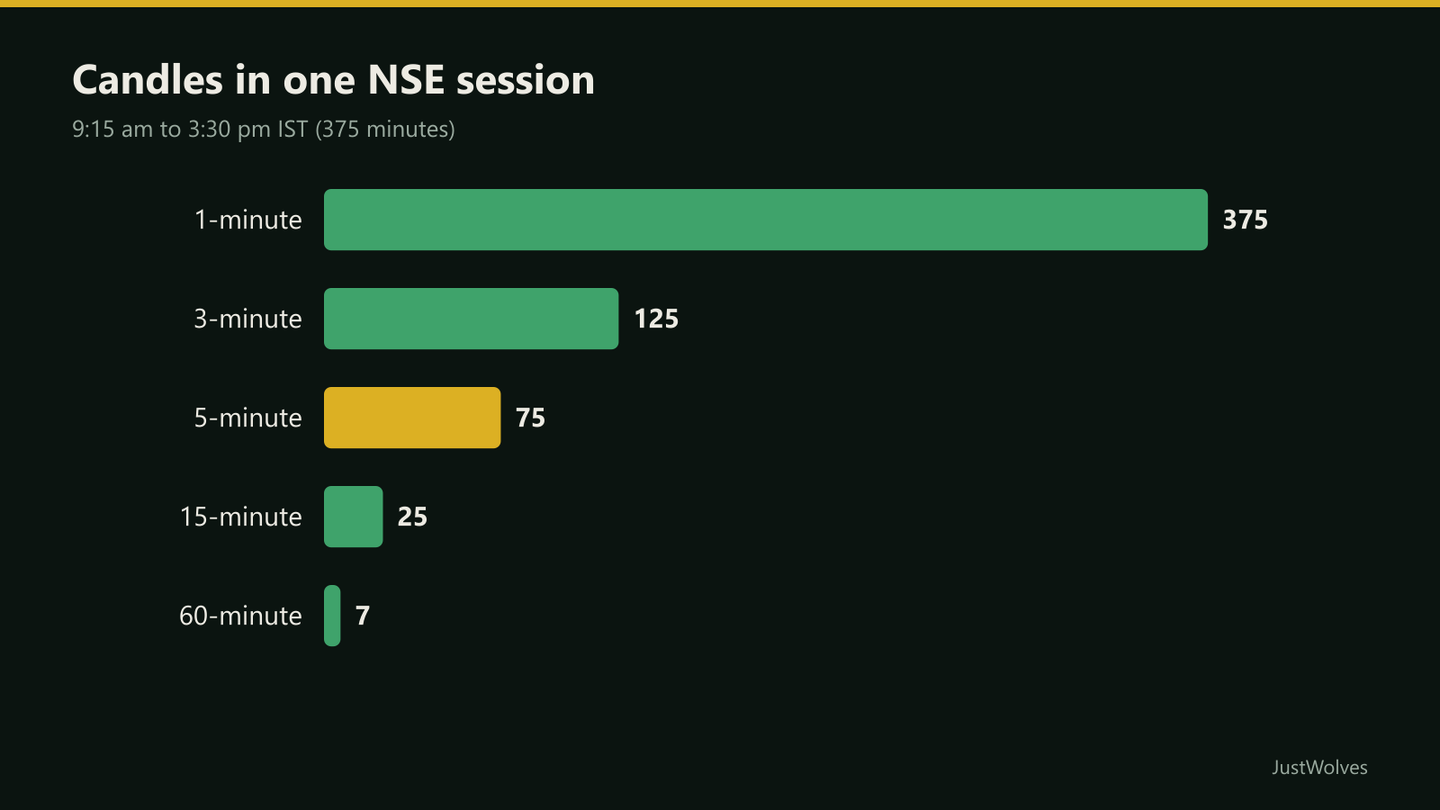
| Chart | Candles per session | Good for | Drawback |
|---|---|---|---|
| 1-minute | 375 | Precise entries and exits | Very noisy; many false signals |
| 3-minute | 125 | Scalping setups with less noise | Still noisy around the open |
| 5-minute | 75 | Intraday setups and structure | Entries slightly later |
| 15-minute | 25 | Intraday trend and key levels | Too slow for scalp entries |
A Practical Combination
Top-down for day traders
Step 1: Daily chart (before the open)
Trend, previous day's high and low, and major levels.
Step 2: 15-minute chart
The session's direction and intraday structure.
Step 3: 5-minute chart
Setups at levels: pullbacks, breakouts, rejections.
Step 4: 1 or 3-minute chart
The precise trigger and stop placement.
Scalpers may drop the 15-minute and use 5-minute for context with 1-minute for entries; intraday traders may use 15-minute for setups and 5-minute for entries. The principle is the same: higher for direction, lower for timing.
Practical Example
Hypothetically, before the open Sanjay notes that Nifty's daily trend is up and the previous day's high is 24,310. At 10:05, the 15-minute chart shows higher highs and higher lows since the open. On the 5-minute chart, price pulls back to the previous day's high and holds.
He switches to the 1-minute chart only to time the entry: a break above the last 1-minute lower high at 24,318. He enters there, places his stop below the 5-minute pullback low at 24,296, and targets the morning high at 24,372. In index terms, risk is 22 points and the target 54 points. He trades it with one lot of a near-the-money call; with a delta of about 0.5, the premium should move roughly half as much as the index, about 11 points of risk and 27 of reward. Charges of about 1 premium point per lot are small relative to both, so he takes the trade.
When Does NIFTY Move? Our Data
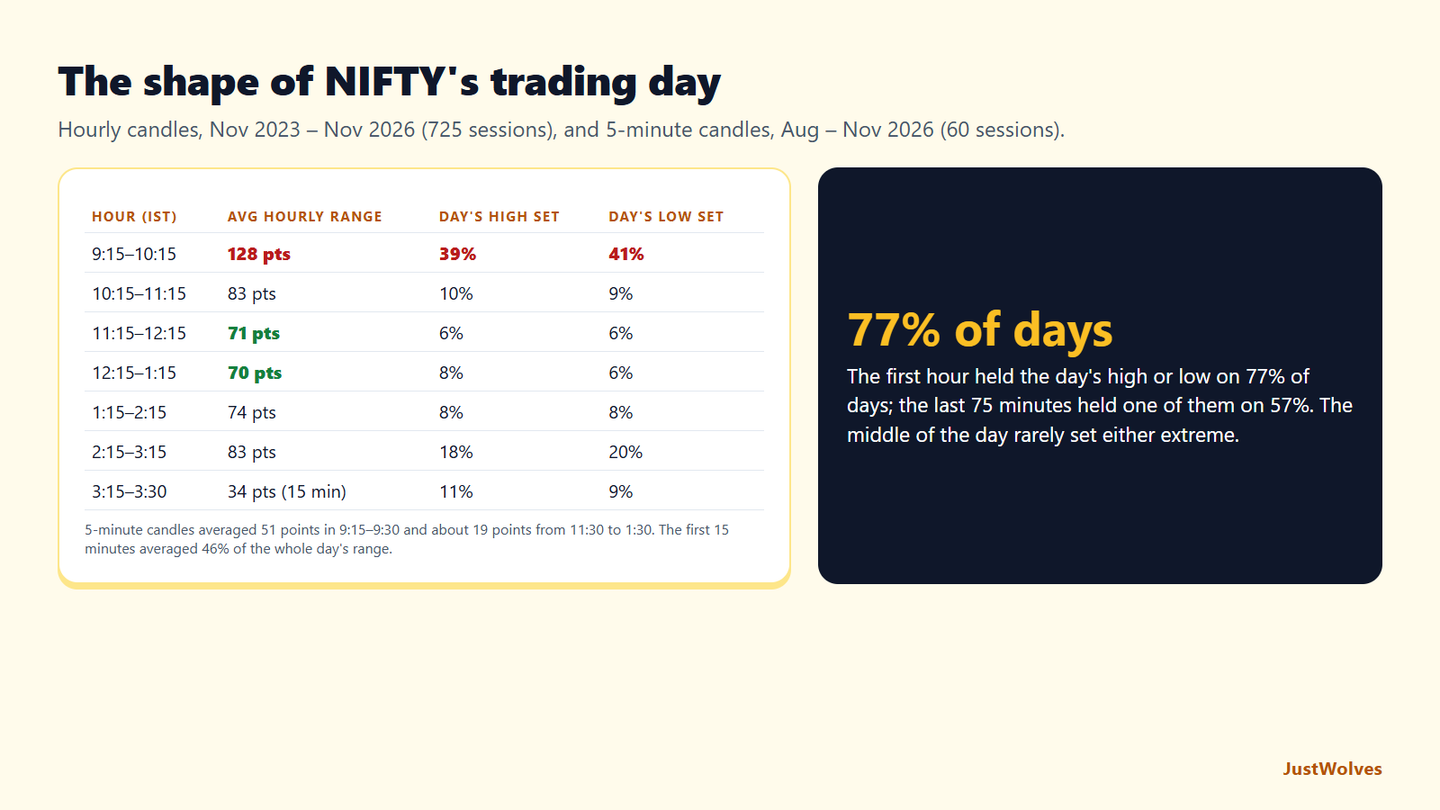
JustWolves measured the shape of the NIFTY 50 trading day over three years of hourly prices (725 sessions, November 2023 to November 2026), and on 5-minute prices for 60 sessions (August to November 2026). For each hour we recorded the average high-to-low range and how often the day's high and low were set in it.
| Hour (IST) | Average range | Day's high set | Day's low set |
|---|---|---|---|
| 9:15–10:15 | 128 pts | 39% | 41% |
| 10:15–11:15 | 83 pts | 10% | 9% |
| 11:15–12:15 | 71 pts | 6% | 6% |
| 12:15–1:15 | 70 pts | 8% | 6% |
| 1:15–2:15 | 74 pts | 8% | 8% |
| 2:15–3:15 | 83 pts | 18% | 20% |
| 3:15–3:30 | 34 pts (15 minutes) | 11% | 9% |
The opening hour was the busiest by far. Its average range, 128 points, was almost twice that of any midday hour, and the first 15 minutes alone averaged 46% of the whole day's range in our 5-minute data. The first hour held the day's high or low on 77% of days, though both extremes were set in it on only 4%.
The middle of the day was quiet, as this lesson describes. From 11:15 to 1:15, hourly ranges were about 70 points and the day's high or low was set there on only about one day in seven. That is the lull in which many scalpers stop trading, because moves are smaller relative to costs and reverse more often.
The close mattered more than many expect. The last 75 minutes held the day's high or low on 57% of days, with 2:15 to 3:15 the busiest hour after the open.
The practical reading supports this lesson's professional insight about trading the clock: the opening phase offers the most movement, with the most slippage risk; the midday phase offers the least; and the closing phase often finishes the day's move. Tag your own trades by time, as this lesson suggests, and compare your results with this shape.
Common Mistakes
- Trading only the 1-minute chart without context.
- Ignoring the session phase when choosing setups.
- Switching timeframes mid-trade.
- Stops based on 1-minute noise for 5-minute setups.
- Trading through the midday lull out of boredom.
Professional Insight
Many experienced day traders say they trade the clock as much as the chart. They know which phases suit their setups, and they're often finished for the day by 11 am or wait until the afternoon to start. Fewer hours at the screen, at the right times, tends to produce better decisions than watching every candle.
Risk Considerations
- Opening volatility widens spreads and slippage.
- Midday chop produces false signals.
- Expiry-day closes can be erratic in options.
Important Terminology
| Term | Meaning |
|---|---|
| Pre-open session | 9:00–9:15 am, when opening prices are discovered. |
| Session phase | A part of the trading day with typical behaviour. |
| Timeframe | The period each candle represents. |
| Context chart | A higher timeframe used for direction. |
| Trigger chart | A lower timeframe used to time entries. |
What are Indian stock market trading hours?
Continuous trading on NSE runs from 9:15 am to 3:30 pm IST, after a 9:00–9:15 pre-open session in the cash market.
What is the best timeframe for intraday trading?
There's no single best. A common setup uses 15-minute for context, 5-minute for setups and 1 or 3-minute for entries.
When is the market most active?
Usually in the first hour after the open and the last hour before the close.
Is the 1-minute chart good for scalping?
It's useful for entries, but too noisy to use alone. Pair it with a higher timeframe for context.
Should I trade during the midday period?
Many traders avoid it because ranges narrow and price action gets choppy, but check your own results by time of day.
What is the most active time to trade NIFTY intraday?
The first hour after 9:15 am. In our three-year NIFTY 50 data, the 9:15–10:15 hour averaged a 128-point range, almost twice the midday hours, and the first 15 minutes alone averaged 46% of the day's range in recent 5-minute data.
How often is the day's high or low set in the first hour?
Often. Over 725 sessions from November 2023 to November 2026, NIFTY 50 set its daily high or low in the first hour on 77% of days. The last 75 minutes set one of them on 57% of days.
Practical Exercise
Map the session.
Your task
Step 1: Watch five sessions
On Nifty futures or options, 5-minute chart.
Step 2: Record each phase
Range and character from 9:15–10:15, 10:15–13:30 and 14:30–15:30.
Step 3: Choose your timeframes
Context, setup and trigger charts.
Step 4: Write them down
Along with the phases you'll trade.
Check Your Understanding
NSE continuous trading runs:
Related Lessons
Previous: Execution Speed and Transaction Costs. Next module: VWAP for Intraday Traders. See also Opening Range Breakout (ORB).