
Capital Preservation and Risk of Ruin: How Bet Size Decides Survival
JustWolves is an educational platform and is not a SEBI-registered investment advisor. Trading financial instruments involves significant risk of loss and may not be suitable for all investors. Past performance is not indicative of future results. Read our full disclaimer →
What you'll learn
- Risk of ruin is the chance of losing so much that you can't or won't keep trading your plan
- It depends on your edge, your payoff, your risk per trade and how many trades you take
- Even a strategy with a real edge can blow up an account if each bet is too large
- No position size can rescue a strategy with negative expectancy
- Capital preservation means sizing for the drawdowns you will meet, not the average result you hope for
In this article · 17 sections
Most traders who lose their account don't lose it to one catastrophic trade. They lose it to a normal run of losses, taken at a size that turned an ordinary bad patch into a hole they couldn't climb out of. Risk of ruin is the number that describes that danger, and capital preservation is the habit that keeps it close to zero.
What You Will Learn
- What risk of ruin means and why it matters more than any single trade
- The four things that drive it: edge, payoff, risk per trade and number of trades
- Why a profitable strategy can still ruin an account, and why sizing can't save an unprofitable one
- How large the drawdowns at different risk levels typically are, so you can plan for them
Before You Start
Read Risk Management: Why It Comes First first. You should understand risk per trade, losing streaks and drawdowns. Familiarity with position sizing helps but isn't essential.
What Capital Preservation Means
Capital preservation is the priority of protecting the money you trade with, so that you are still able to trade when your edge pays off. It doesn't mean avoiding all losses, which is impossible. It means making sure no single trade, day or losing streak can do damage you can't recover from.
The reason is the drawdown arithmetic from the previous lesson: a 20% loss needs a 25% gain to recover, but a 50% loss needs 100%. Past a certain depth, recovery becomes unrealistic, and that is the point traders call ruin.
What Is Risk of Ruin?
Risk of ruin is the probability that your account falls to a level at which you can no longer, or will no longer, carry on trading your plan. Strictly, ruin means losing everything. In practice most traders stop, change strategy or blow their discipline long before that, so it's more useful to set a personal ruin line.
In this lesson, ruin means losing half of the starting account. That is a realistic line: at −50% you need a 100% gain to recover, and few traders keep following the same rules after losing half their money.
The Four Drivers of Risk of Ruin
- Edge (win rate): how often your trades win.
- Payoff: how large the average win is compared with the average loss. Together with win rate this gives your expectancy, covered in lesson 12.01.05.
- Risk per trade: the share of your account lost when a stop is hit. This is the one driver you control completely, on every trade.
- Number of trades: the more trades you take, the more chances a long losing streak has to appear.
Edge and payoff come from your strategy and can only be estimated. Risk per trade is a decision. That is why sizing is where capital preservation actually happens.
A Simulation: Same Strategy, Five Bet Sizes
To show how bet size changes the odds, we simulated a strategy with a genuine but modest edge: it wins 45% of trades, and winners are 1.5 times the size of losers. Its expectancy is +0.125R per trade, so over time it makes money.
We ran 20,000 simulated accounts, each taking 500 trades, at five risk levels. Each trade risks a fixed percentage of the account as it stands at the time. An account counts as ruined if it ever falls to half its starting value.
| Risk per trade | Accounts that lost half | Typical worst drawdown (median) | Bad-case worst drawdown (1 in 10) |
|---|---|---|---|
| 0.5% | none of 20,000 | 8.0% | 12.4% |
| 1% | none of 20,000 | 15.6% | 23.5% |
| 2% | 0.6% | 29.5% | 42.8% |
| 5% | 18.0% | 59.0% | 74.7% |
| 10% | 56.4% | 78.1% | 93.4% |
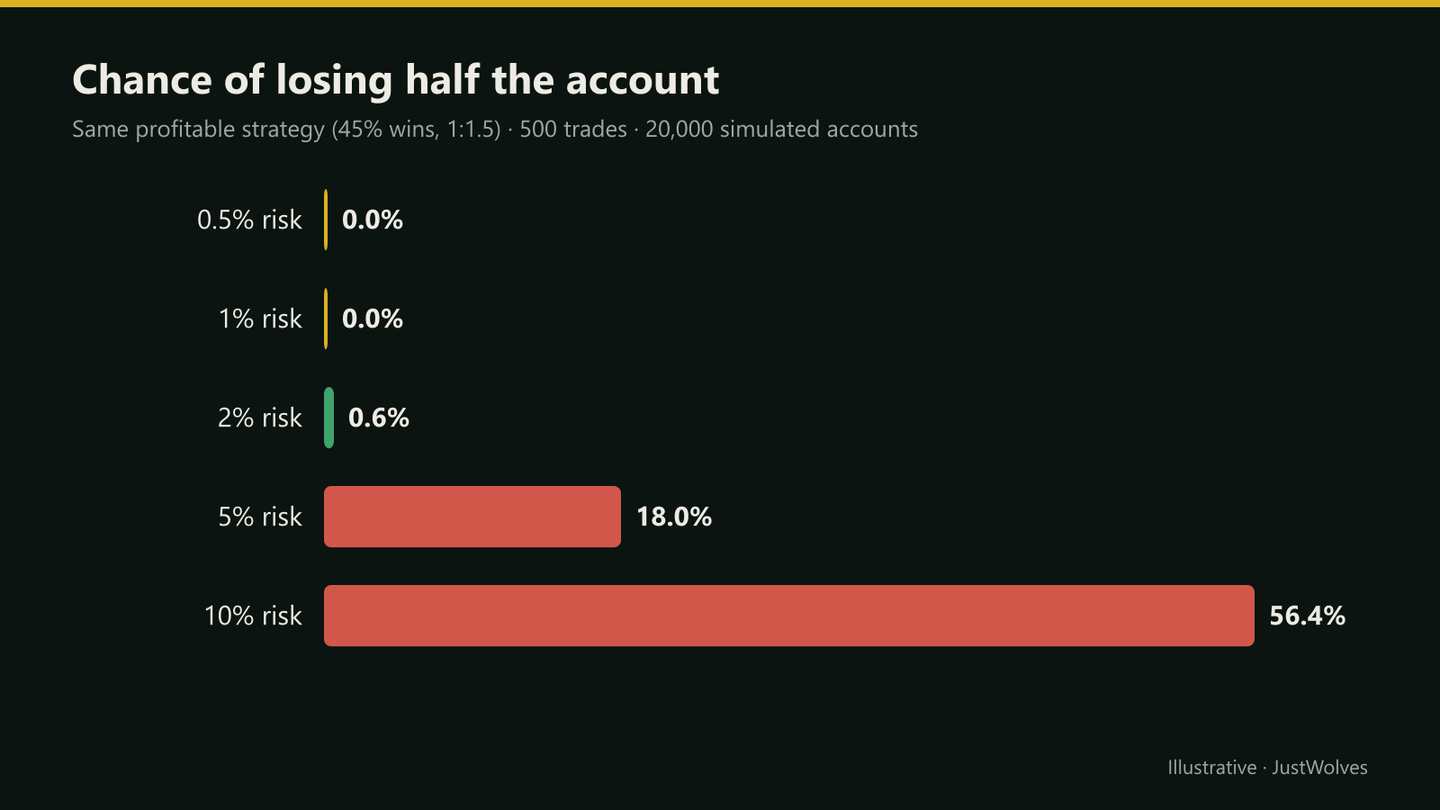
Look at the last row. The strategy makes money on average, yet more than half of the accounts risking 10% per trade lost half their capital at some point. The edge was real; the bet size destroyed it. At 1%, not one of 20,000 accounts crossed the ruin line, even though their typical worst drawdown was still around 16%.
When the Edge Isn't There
Now the same experiment with a strategy that has a small *negative* edge: 40% winners at 1:1.2, an expectancy of −0.12R per trade. Many beginners trade something like this without knowing it.
| Risk per trade | Accounts that lost half |
|---|---|
| 1% | 46.0% |
| 2% | 94.0% |
| 5% | 99.8% |
Small bets only slow the decline. With a negative edge, the question isn't whether the account shrinks but how fast. Position sizing protects a good strategy; it cannot rescue a bad one. That's why measuring your real expectancy (lesson 12.01.05) and testing a strategy before trading it (module 12.04) matter as much as sizing.
Plan for the Drawdowns You Will Meet
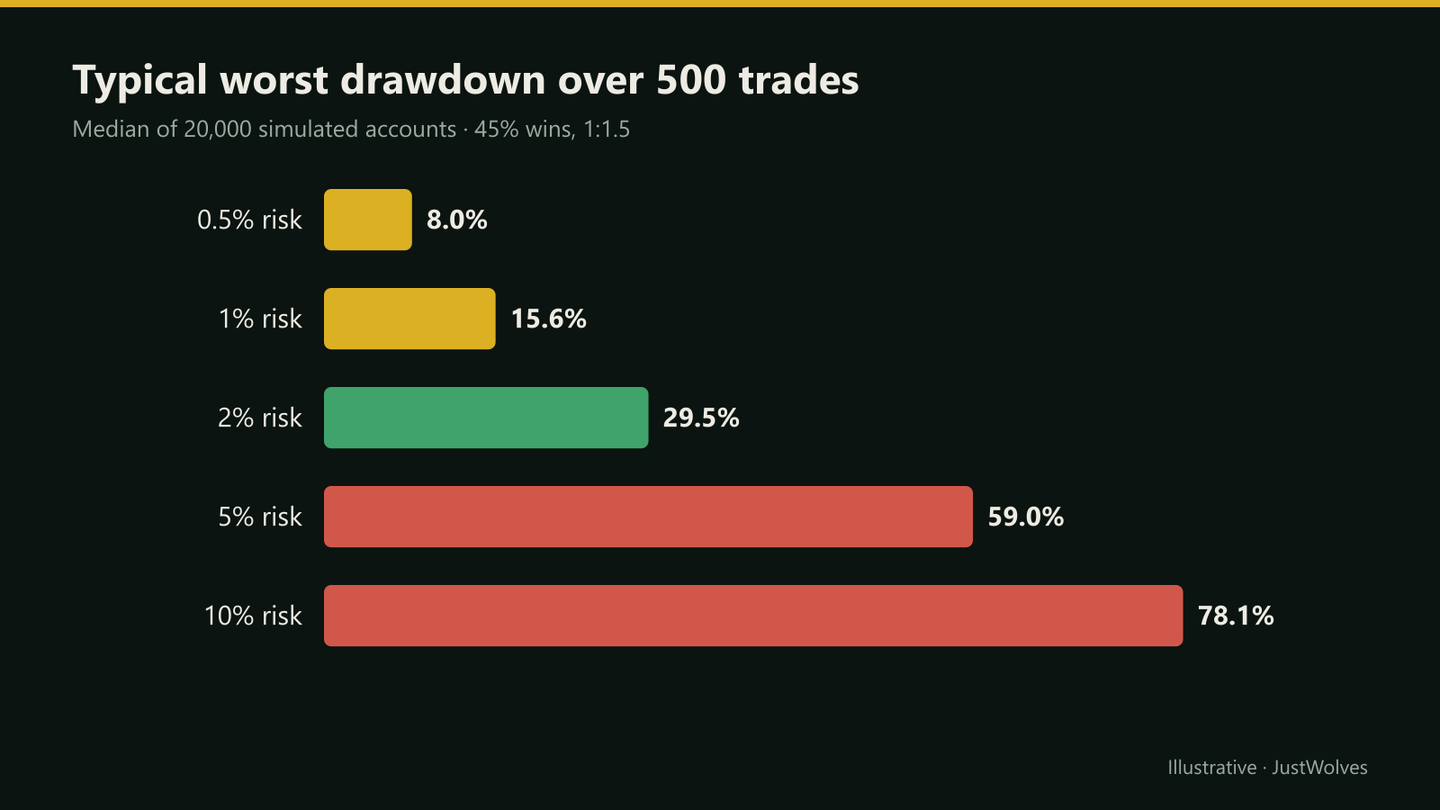
This chart is the practical lesson. If you risk 1% per trade with a decent strategy, a drawdown of around 15% is *normal*, and one in ten accounts saw more than 23%. Decide in advance that you can live with that, both financially and emotionally. If you can't, risk less.
Real Prices: When Losses Cluster
Planning for drawdowns means planning for losing streaks longer than the averages suggest. The chart below shows NIFTY 50 during a real 22-trade losing streak in a simple NSE breakout strategy, from July to October 2026.
Real prices: the market behind a 22-trade losing streak, NIFTY 50, July – November 2026
Step 1 of 4
A firm market
Through July 2026 NIFTY 50 moves between about 23,600 and 24,500. On 29 July a breakout trade in the JustWolves 20-day breakout stream loses, the first of what becomes a long run.
- What to observe
- Nothing on the chart looks dangerous yet.
- Condition
- Breakouts need a rising market to follow through.
Capital Preservation Rules, Step by Step
Setting up your protection
Step 1: Choose your ruin line
Write down the drawdown at which you would stop trading or change your approach, for example −25%. If you trade a prop firm account, use its maximum drawdown rule.
Step 2: Set risk per trade from that line
Keep your typical bad-case drawdown well inside the line. As a starting point, 0.5–1% per trade keeps simulated bad-case drawdowns near or below 25% for a modest edge.
Step 3: Add a circuit breaker
Set a drawdown at which you halve your risk per trade, for example −10%, and a deeper one at which you stop and review, for example −20%. Lesson 12.02.04 covers daily and weekly limits.
Step 4: Measure your real edge
Track win rate and payoff in a journal. If your expectancy turns negative over a meaningful sample, stop trading the strategy, however small your bets.
Step 5: Never increase risk to recover
Raising risk after losses is the single fastest route to ruin. Recover by continuing the plan, not by betting bigger.
Practical Example
Karan trades a ₹4,00,000 account and decides that a 25% drawdown, about ₹1,00,000, is his ruin line: beyond that he would stop. His backtest suggests roughly a 45% win rate at 1:1.5.
At 2% risk, the simulation's bad-case drawdown (42.8%) is well past his line. At 1% the bad case is about 23.5%, close to the line but inside it, and at 0.5% it's about 12%. He chooses 0.75% while his live results are still short of 100 trades, with a rule to drop to 0.5% if he is ever 10% below his peak.
Nothing in this plan predicts a single trade. It simply makes sure that the losing streaks he will certainly meet don't end his trading.
Risk of Ruin With Real Trades
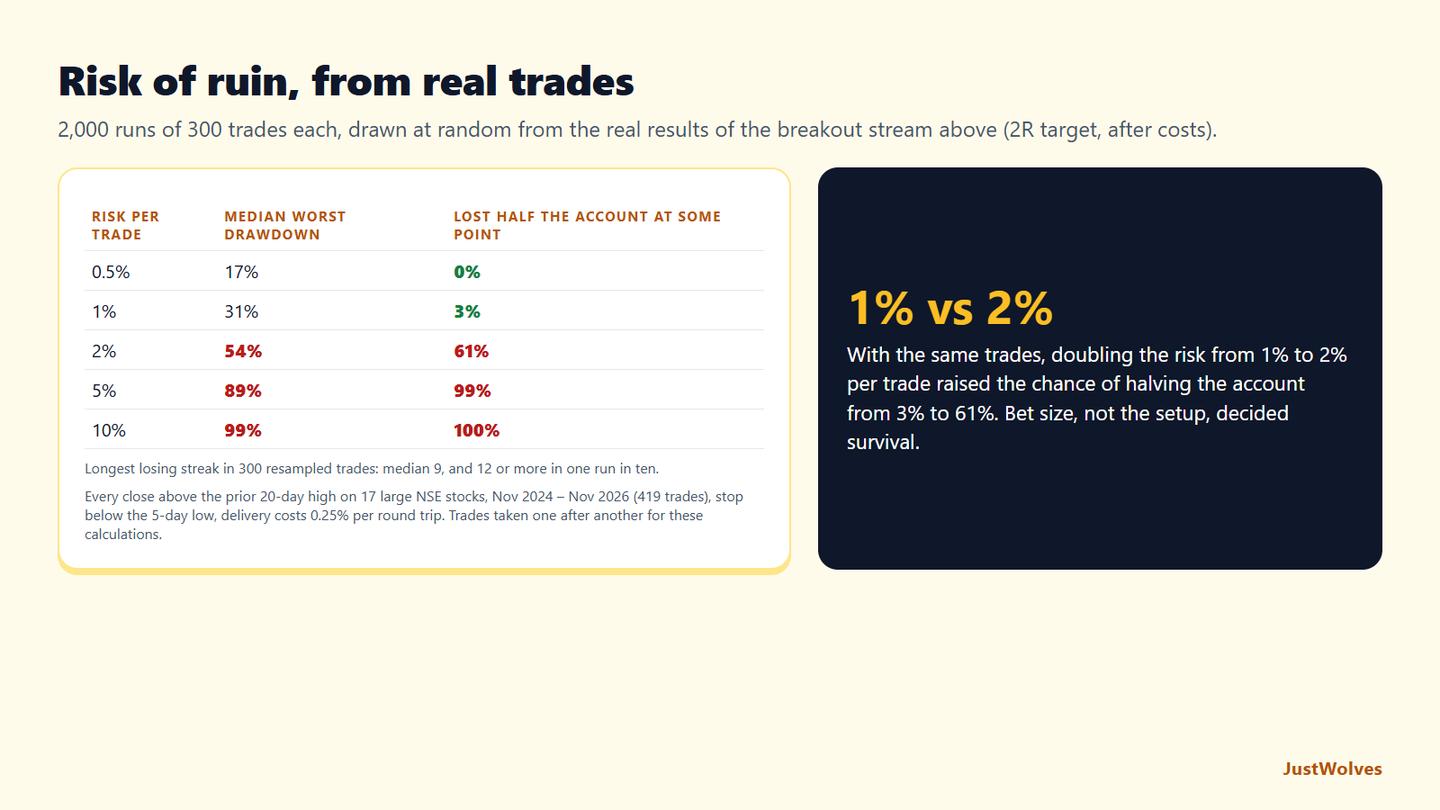
The simulations in this lesson use an assumed win rate and payoff. JustWolves repeated the exercise with real trade results: the 419 trades of a simple 20-day breakout strategy on 17 large NSE stocks (November 2024 to November 2026), with a 2R target and delivery costs of 0.25% per round trip, an expectancy of −0.08R per trade. We drew 2,000 random sequences of 300 trades from those real results and compounded each at different risk per trade, recording the worst drawdown and whether the account ever lost half its value.
| Risk per trade | Median worst drawdown | Lost half the account at some point |
|---|---|---|
| 0.5% | 17% | 0% |
| 1% | 31% | 3% |
| 2% | 54% | 61% |
| 5% | 89% | 99% |
| 10% | 99% | 100% |
The cliff came between 1% and 2%. With exactly the same trades, 1% risk per trade halved the account in only 3% of runs, while 2% did so in 61%. Above that, ruin was close to certain. That matches the shape of this lesson's simulation: risk of ruin does not rise gently with bet size; it accelerates.
This strategy had a slightly negative edge, which is the situation this lesson's negative-edge section describes. With a small negative expectancy, a small bet size slows the decline enough to give the trader time to notice and stop; a large one makes the end arrive quickly. With a positive edge, the same bet sizes would be safer, but the order of magnitude of the drawdowns would be similar.
Resampling understates clustering. Random draws gave a median longest losing streak of 9, but in real date order the same trades lost 22 in a row, as the chart above shows. Real risk of ruin is higher than a shuffled simulation suggests, which is another reason to stay at the low end of the risk range.
Common Mistakes
- Treating a positive backtest as proof of safety. The simulation shows a profitable strategy can still ruin an over-sized account.
- Defining ruin as zero. Most traders quit or abandon their rules far earlier; plan for your real breaking point.
- Ignoring the drawdown you'll feel. A strategy that is 'fine on average' may still put you 30% down for months.
- Trusting a small sample. A win rate measured over 20 trades says little about your true edge.
- Raising size after losses. It increases risk exactly when your account is weakest.
Advanced Insight: The Kelly Criterion
The Kelly criterion gives the bet size that would grow an account fastest if you knew your edge exactly: f = win rate − (loss rate ÷ R). For our example strategy, f = 0.45 − 0.55 ÷ 1.5 ≈ 8.3% per trade.
That number is a ceiling, not a recommendation. Full Kelly produces brutal drawdowns, as the 10% row of our table shows, and in real trading you never know your edge exactly; overestimating it pushes you past Kelly, where growth turns into decline. Professionals who use Kelly at all typically bet a small fraction of it, which in practice lands close to the 0.5–1% range used throughout this course.
Risk Considerations
- Simulations understate real risk. Real losing streaks cluster, costs reduce the edge, and gaps can make a loss larger than the planned 1R.
- Leverage changes the picture. In F&O and forex, a gap can lose more than the stop allows; leverage and margin risk are covered in lesson 12.02.05.
- Correlated positions behave like one larger bet, raising your effective risk per trade (lesson 12.02.06).
Important Terminology
| Term | Meaning |
|---|---|
| Capital preservation | Protecting trading capital so that no trade or losing streak causes damage you can't recover from. |
| Risk of ruin | The probability of reaching a loss level at which you can't or won't keep trading your plan. |
| Ruin line | The drawdown you personally define as ruin, for example −25% or a prop firm's limit. |
| Expectancy | Average result per trade, in R: (win rate × average win) − (loss rate × average loss). |
| Monte Carlo simulation | Running many randomised versions of a strategy to see the range of outcomes it can produce. |
| Kelly criterion | A formula for the growth-maximising bet size, given a known edge; a ceiling, never a target. |
What is risk of ruin in trading?
It is the probability that your account falls to a level where you can no longer, or will no longer, keep trading your plan. Many traders define that level as a 25–50% loss rather than zero.
How do I reduce my risk of ruin?
Lower your risk per trade, trade only strategies with a measured positive expectancy, and set drawdown limits that cut size or stop trading before losses become unrecoverable.
Can a profitable strategy blow up an account?
Yes. In our simulation, a strategy that made money on average still lost half the account in more than half of runs when it risked 10% per trade. Bet size matters as much as edge.
Is there a formula for risk of ruin?
Simple formulas exist for idealised cases, but for realistic settings, with percentage-based sizing, varying payoffs and a ruin line above zero, a simulation like the one in this lesson is the practical way to estimate it.
What risk per trade keeps risk of ruin low?
For a modest edge, 0.5–1% per trade kept simulated ruin (losing half the account) close to zero over 500 trades. A weaker or uncertain edge needs less.
What risk per trade keeps the risk of ruin low?
In our resampling of 419 real NSE breakout trades, 0.5% per trade never halved the account in 300 trades and 1% did so in 3% of runs, while 2% did so in 61%. The jump between 1% and 2% was dramatic.
Does a Monte Carlo simulation capture real risk?
Only partly. Random reshuffling of our real trades gave a median longest losing streak of 9, but in actual date order the same trades lost 22 in a row, because losses clustered in a falling market.
Practical Exercise
Build your own capital-preservation plan in five minutes.
Your task
Step 1: Write your ruin line
The drawdown, in percent and in rupees, at which you would stop trading your current approach.
Step 2: Compare it with the table
Find the highest risk per trade whose bad-case drawdown (1 in 10) stays below your ruin line, then choose something lower to allow for real-world costs and streaks.
Step 3: Set two circuit breakers
A drawdown at which you halve your risk, and one at which you stop and review.
Step 4: Test the plan against your history
If you have a trade journal, check your deepest drawdown so far. Would these rules have stopped it earlier?
Check Your Understanding
In this lesson, what does 'ruin' mean?
Related Lessons
Previous: Risk Management: Why It Comes First. Next: Position Sizing and the 1% Rule, which turns your risk percentage into an exact number of shares or lots. Later in this course: Win Rate, Expectancy and Profit Factor (12.01.05) and Maximum Drawdown and Recovery (12.02.03).