
PD Arrays: FVG, Order Block, Breaker and Balanced Price Range
JustWolves is an educational platform and is not a SEBI-registered investment advisor. Trading financial instruments involves significant risk of loss and may not be suitable for all investors. Past performance is not indicative of future results. Read our full disclaimer →
What you'll learn
- PD arrays are the reference zones ICT uses in premium and discount
- The main ones: old highs and lows, order blocks, fair value gaps, breakers, mitigation and rejection blocks, liquidity voids
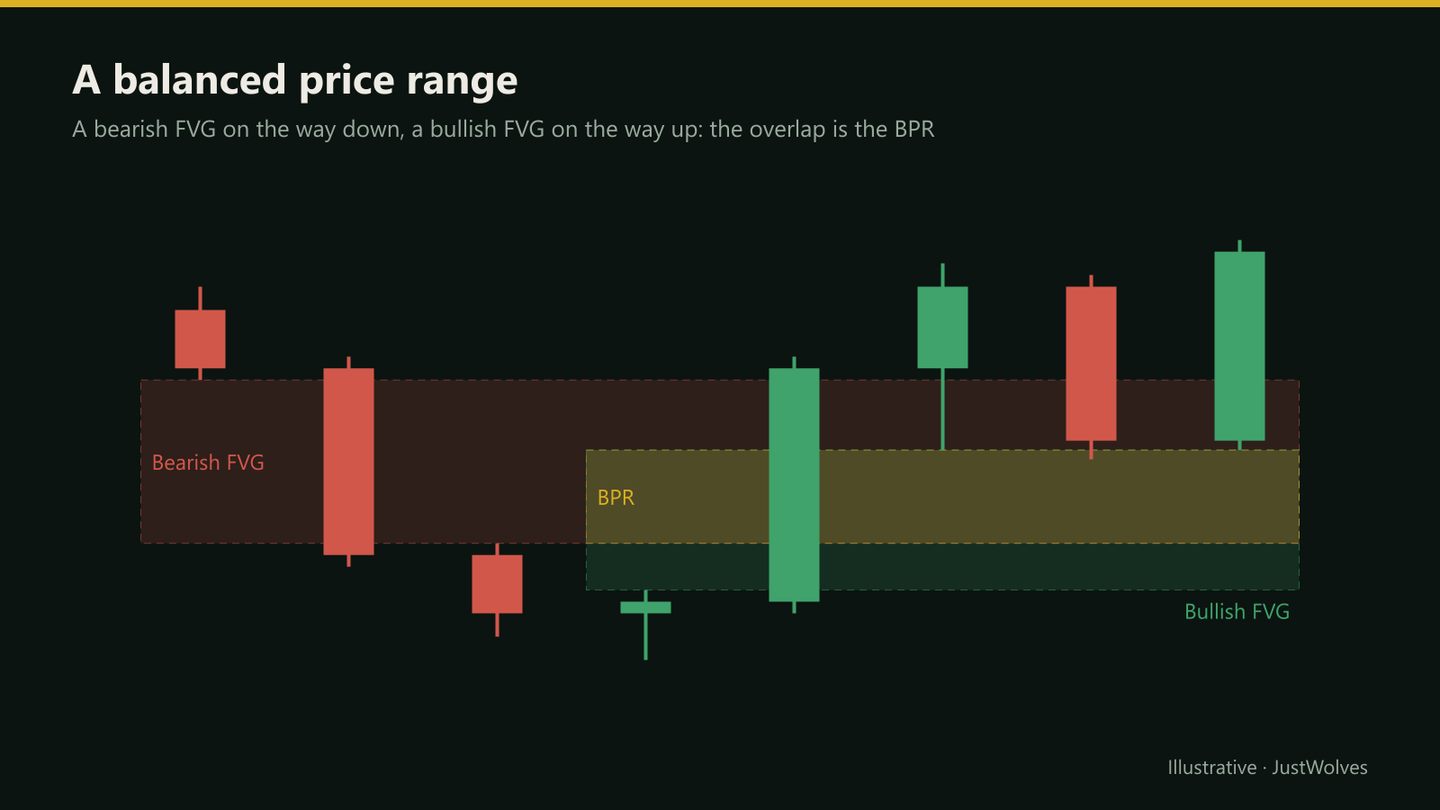
- A balanced price range (BPR) is where a bullish and a bearish FVG overlap
- Arrays are used in the correct half of the range: discount arrays for longs, premium arrays for shorts
- Rankings of which array is 'strongest' vary by source; test them rather than memorising a list
In this article · 16 sections
ICT groups its reference zones under one name: PD arrays, short for premium and discount arrays. You already know most of them from the SMC course. This lesson puts them in one place, adds three that SMC rarely covers (rejection blocks, liquidity voids and the balanced price range), and explains how ICT traders choose between them.
What You Will Learn
- The main PD arrays and how each is defined
- Rejection blocks, liquidity voids and the balanced price range
- How arrays are arranged in premium and discount
- How to choose an array for a trade
Before You Start
Read Dealing Ranges and Premium/Discount Arrays, Order Blocks and Breaker Blocks first.
The Main PD Arrays
| Array | Definition | Covered in |
|---|---|---|
| Old high / old low | A prior swing extreme with resting liquidity beyond it | 02.02.01 |
| Order block | Last opposite candle before a structure-breaking move | 02.03.04 |
| Fair value gap | Gap between candle 1's and candle 3's wicks | 02.03.02 |
| Breaker block | A failed order block after a sweep, used in reverse | 02.03.05 |
| Mitigation block | A failed order block without a prior sweep | 02.03.05 |
| Rejection block | The wick area of a candle that rejected a level | This lesson |
| Liquidity void | A large, fast, one-sided range with little trading | This lesson |
| Balanced price range | The overlap of a bullish and a bearish FVG | This lesson |
Rejection Block
A rejection block is the wick region of a candle (or cluster of candles) with long wicks at a swing extreme, where price was clearly rejected. For a bearish rejection block at a high, the zone runs from the highest body close to the top of the wick. Traders watch it for a reaction when price returns, with a stop beyond the wick high.
Liquidity Void
A liquidity void is a larger version of an imbalance: a long, fast, one-directional run, often several candles, where there was very little opposing trading. ICT treats voids as areas price tends to move back through quickly when it returns, rather than places it reacts from. In SMC terms, it's an imbalance (lesson 02.03.01) that may contain several FVGs.
Balanced Price Range (BPR)
A balanced price range forms when price moves sharply one way, leaving an FVG, then sharply back the other way, leaving an opposite FVG that overlaps the first. The overlapping area is the BPR.
Because it was 'offered' in both directions, ICT treats it as a strong reference zone. After a bullish move through a bearish FVG, the overlap acts as a potential support zone on a return.
Watch a BPR Form
A balanced price range is easier to see than to describe. Step through the chart to watch the two opposite gaps form and overlap.
A balanced price range forming, step by step
Step 1 of 5
A sharp drop leaves a bearish FVG
Candle 2's low (150.45) and candle 4's high (150.20) leave a bearish fair value gap from 150.20 to 150.45.
- What to observe
- A gap above price.
- Condition
- Mark it.
Arranging Arrays in the Range
ICT material arranges the arrays in a 'PD array matrix': the same types of zone appear in premium (as places to sell, in a bearish bias) and in discount (as places to buy, in a bullish bias), with old highs and lows at the outer edges as liquidity targets.
Different sources rank the arrays differently: some favour order blocks, others FVGs or breakers. Rather than memorise a ranking, prefer arrays that are in the correct half of the range, unmitigated, created by a move that broke structure, and aligned with the higher-timeframe bias.
Step by Step: Choosing an Array
For a bullish bias
Step 1: Draw the dealing range
Mark equilibrium.
Step 2: List discount arrays
FVGs, OBs, breakers, BPRs and rejection blocks below equilibrium.
Step 3: Filter
Unmitigated, formed in the move that broke structure, room to target.
Step 4: Prefer confluence
An FVG inside an order block, or a BPR at an old low, beats an isolated zone.
Step 5: Wait for the trigger
A lower-timeframe MSS from the chosen array.
A Practical Ranking of Arrays
When several arrays sit near each other, a short ranking rule keeps decisions consistent:
- Higher timeframe beats lower timeframe. A 4H gap outranks a 15-minute order block.
- Untouched beats revisited. In our data, almost every gap is revisited at least once, and the first visit is the one with the best chance of holding.
- In discount (for longs) or premium (for shorts) beats equilibrium. An array on the wrong side of the dealing range is skipped.
- Overlap beats isolation. A BPR or a gap inside an order block concentrates two reasons into one zone.
Pick the single highest-ranked array for your entry and ignore the rest. Placing orders at three nearby arrays is just averaging into a position without a plan.
Practical Example
Hypothetically, on the 1-hour USD/JPY chart, a sharp drop leaves a bearish FVG at 150.20–150.45, and the rally that follows leaves a bullish FVG at 150.10–150.32. The overlap, 150.20–150.32, is a BPR, and it sits in discount of the current dealing range.
Nikhil marks the BPR as his preferred array, ahead of an isolated FVG higher up in premium. When price returns to 150.28 and a 5-minute MSS forms, he buys with a stop at 150.05, targeting the range high at 150.90.
How Fair Value Gaps Behaved in Our Test
The fair value gap is the most used PD array, so JustWolves measured how real ones behaved. Data: about six months of 1H candles (May–November 2026) on EUR/USD, GBP/USD, USD/JPY and gold. Gaps: every bullish and bearish FVG at least 30% of an average hourly candle in size (1,296 gaps), followed for 48 hours.
| Measure | Result |
|---|---|
| Price came back to the gap within 48 hours | 89% |
| Of those, price reached the gap's 50% level (consequent encroachment) | 94% |
| Held: price moved one average candle away in the gap's direction before closing through it | 60% |
| Failed: price closed through the far side of the gap first | 40% |
Two lessons stand out. First, fair value gaps are revisited almost all the time, and the revisit usually goes at least halfway in. Entries at the near edge of a gap are therefore rarely the best price; the 50% level is reached on most returns.
Second, a revisited gap held about 60% of the time and failed about 40%. That is a useful lean, not a certainty, and it is why the PD array matrix only works with a bias and a stop beyond the gap. A trader who buys every bullish gap is wrong four times in ten before costs, and needs winners larger than losers to come out ahead.
Common Mistakes
- Marking every array type at once, until the chart is unreadable.
- Ignoring premium and discount when choosing arrays.
- Treating liquidity voids as reaction zones.
- Memorising a ranking instead of testing it.
- Re-using mitigated arrays.
Professional Insight
Experienced traders usually work with two or three array types they understand deeply. A short list, applied consistently, gives cleaner charts and cleaner statistics than trying to use every array ICT describes.
Risk Considerations
- Arrays fail, especially against the higher-timeframe trend.
- Overlapping zones can create false confidence.
- Too many arrays encourage hindsight labelling.
Important Terminology
| Term | Meaning |
|---|---|
| PD array | A reference zone used in premium or discount. |
| Rejection block | The wick area of a candle that rejected a level. |
| Liquidity void | A fast, one-sided range with little trading, often several FVGs. |
| Balanced price range (BPR) | The overlap of a bullish and a bearish FVG. |
| PD array matrix | ICT's arrangement of arrays in premium and discount. |
What are PD arrays in ICT?
Premium and discount arrays: reference zones such as FVGs, order blocks and breakers, used according to where they sit in the dealing range.
What is a balanced price range?
The overlap between a bearish FVG and a bullish FVG formed by sharp moves in opposite directions.
What is a rejection block?
The wick area of a candle that rejected a swing high or low, used as a reaction zone.
What is a liquidity void?
A fast, one-sided range with little trading, which price often moves back through quickly.
Which PD array is strongest?
Sources disagree. Prefer unmitigated arrays in the correct half of the range, created by a structure-breaking move, and test your choices.
How often are fair value gaps filled?
In our test of 1,296 real 1H fair value gaps on four markets, price returned to the gap within 48 hours 89% of the time, and 94% of those returns reached the gap's 50% level.
Do fair value gaps usually hold?
About 60% of revisited gaps in our test held (price moved away in the gap's direction before closing through it) and 40% failed. They are a lean, not a guarantee.
Do I need to use every PD array?
No. Most traders work with two or three they understand well, such as fair value gaps and order blocks, and ignore the rest. Using fewer arrays makes your rules clearer and your results easier to test.
Practical Exercise
Build a PD array map.
Your task
Step 1: Choose a 1-hour chart
And draw the dealing range.
Step 2: Mark arrays
Up to three types only: for example FVGs, OBs and BPRs.
Step 3: Label premium or discount
For each array.
Step 4: Track reactions
Which arrays did price react from over the next week?
Check Your Understanding
A BPR is:
Related Lessons
Previous: Dealing Ranges and Premium/Discount Arrays. Next: Inversion Fair Value Gaps and FVG-in-FVG. See also Order Blocks.