
The Asian Range and London and New York Session Concepts
JustWolves is an educational platform and is not a SEBI-registered investment advisor. Trading financial instruments involves significant risk of loss and may not be suitable for all investors. Past performance is not indicative of future results. Read our full disclaimer →
What you'll learn
- The Asian range is the high and low formed in the Asian session, often 8 pm–midnight New York time
- London frequently trades through one side of the Asian range early in its session
- Whether that's a sweep or a breakout decides the trade: judge it by the close
- New York often continues the London move, or reverses it after taking London's high or low
- These are tendencies to track, not rules that hold every day
In this article · 13 sections
ICT describes the trading day as a sequence: Asia builds a range, London attacks it, and New York continues or reverses what London started. That sequence doesn't play out every day, but it happens often enough that many traders plan around it. This lesson explains how to mark the Asian range, what London and New York typically do with it, and how to turn that into a plan.
What You Will Learn
- How to define and mark the Asian range in IST
- Common London session behaviours around the range
- How New York relates to the London move
- How to plan a session-based trade
Before You Start
Read ICT Kill Zones in IST and Liquidity Sweep vs Displacement first.
The Asian Range
The Asian range is the high and low price made during the Asian session. A common ICT definition uses 8 pm to midnight New York time, which is about 6:30–10:30 am IST in northern winter and 5:30–9:30 am IST in summer. Some traders use the whole Tokyo session instead; pick one definition and keep it.
Because the Asian session is often quieter, the range tends to be relatively tight. Its high and low are obvious levels with likely resting orders (buy stops above, sell stops below), which is why London often targets them.
What London Often Does
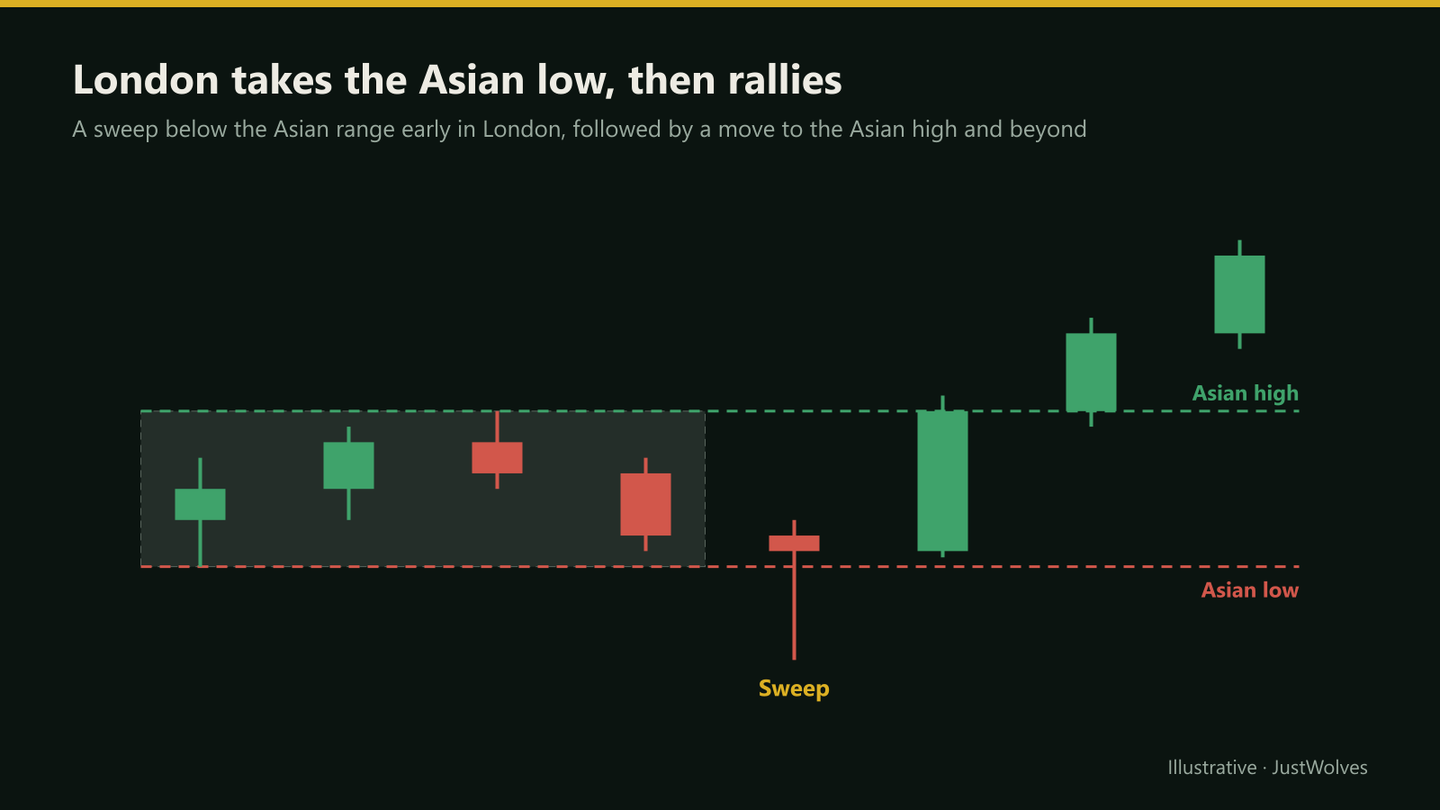
- Sweep and reverse: London trades through one side of the Asian range, fails to hold, and reverses towards the other side. This is the setup the Judas swing lesson (03.02.04) builds on.
- Break and run: London breaks one side with displacement and keeps going; the Asian range becomes a launch point.
- Inside day: London stays inside the range; often a sign of a quieter day.
Use the test from lesson 02.02.03 to tell them apart: a wick through and a close back inside suggests a sweep; a strong close beyond with a fair value gap suggests a breakout.
A practical filter many traders use: if the Asian range is unusually wide, for example larger than its recent average, London is less likely to produce a clean sweep and reversal, because much of the day's range may already be spent. Note the Asian range size in pips every day so you know what normal looks like for your pair.
What London Actually Did With the Asian Range
JustWolves measured this on about 520 trading days of real hourly data (May–November 2026) for EUR/USD, GBP/USD, USD/JPY and gold, using the 20:00–midnight New York definition of the Asian range and 02:00–05:00 New York for the London kill zone.
| What happened | Share of days |
|---|---|
| London traded above the Asian high | 49% |
| London traded below the Asian low | 49% |
| London took both sides | 11% |
| London stayed inside the Asian range | 13% |
| London took one side, then price reached the other side by 12:00 New York ("sweep and reverse") | 21% |
| When London took one side, New York (07:00–10:00) pushed further the same way | 61% |
London took at least one side of the Asian range on about 87% of days, so the range really is a reliable liquidity target. What happened next was usually not the textbook reversal. The full "sweep one side, run to the other" pattern happened on about one day in five. Continuation was more common: when London took one side, New York extended in the same direction on about three days in five.
The filter mentioned above also had some support. When the Asian range was wider than its recent average, the sweep-and-reverse pattern happened a little less often (18% of days) than after a narrower range (23%). The difference is small.
For trading, two conclusions follow. Treat a London break of the Asian range as neutral information until the candle closes and the next hour confirms. And give continuation trades in New York at least as much attention as reversals. In our CRT tests, buying or selling London sweeps of the Asian range mechanically lost money (see CRT with ICT Concepts).
What New York Often Does
- Continuation: if London made a clean move with the higher-timeframe bias, New York often extends it, using a pullback early in the New York kill zone as an entry.
- Reversal: if London ran into a higher-timeframe level, New York may take London's high or low and reverse, especially around the 8:30 am New York data releases (6:00–7:00 pm IST).
- Consolidation: after a large London move, New York sometimes simply ranges.
Step by Step: A Session Plan
Before London
Step 1: Mark the Asian high and low
Using your fixed definition.
Step 2: Mark higher-timeframe context
Bias, dealing range, previous day high and low.
Step 3: Decide the preferred side
In a bullish bias, a sweep of the Asian low is the more interesting scenario; in a bearish bias, a sweep of the high.
Step 4: Wait for London
Classify the first move as sweep, breakout or inside.
Step 5: Plan New York
Continuation or reversal, depending on where London ended relative to key levels.
The Session Plan on a Chart
The chart below walks through one day using the session plan above: mark the Asian range, watch what London does with it, and see whether New York continues. Each step notes how common that stage was in our data.
One day, three sessions: a session plan step by step
Step 1 of 4
Mark the Asian range and the targets
From 20:00 to midnight New York time (6:30–10:30 am IST in winter), EUR/USD ranges between 1.0842 and 1.0861. The 4H bias is bullish and the previous day's high, 1.0890, is the obvious upside target.
- What to observe
- A 19-pip overnight range below a clear target.
- Condition
- Plan: if London sweeps the low and fails, look for longs.
Mark your own Asian ranges: USD/JPY 1H
Loading historical candles…
Practical Example
Hypothetically, on a winter day, EUR/USD's Asian range (6:30–10:30 am IST) is 1.0842–1.0861. The 4-hour bias is bullish and the previous day high is 1.0890.
At 1:10 pm IST, in the London kill zone, price dips to 1.0836, below the Asian low, and the 15-minute candle closes back at 1.0845: a sweep. A 5-minute bullish MSS follows. Leela buys at 1.0847 with a stop at 1.0831, targeting the Asian high first and then the previous day high at 1.0890.
Common Mistakes
- Changing the Asian range definition from day to day.
- Assuming London always sweeps and reverses.
- Trading the first wick before the candle closes.
- Ignoring US data in the New York session.
- Using the pattern against the higher-timeframe bias.
Professional Insight
Session behaviour varies with the market regime: in strong trends, London breaks and runs more often; in ranges, sweeps and reversals are more common. Keep a simple log of what London and New York did each day; after a month, you'll know how your pair actually behaves, which is better than any general rule.
Risk Considerations
- Sweeps can be followed by a real breakout.
- Narrow Asian ranges produce tight stops that are easily hit.
- News days don't follow session patterns.
Important Terminology
| Term | Meaning |
|---|---|
| Asian range | The high and low formed in the Asian session window. |
| Sweep | Trading through a level and closing back inside. |
| Breakout | A decisive close beyond a level that holds. |
| Continuation | New York extending the London move. |
| Reversal | New York reversing the London move after taking a level. |
What is the Asian range in ICT?
The high and low formed during the Asian session, commonly 8 pm–midnight New York time (about 6:30–10:30 am IST in winter).
Why does London often sweep the Asian range?
The Asian high and low are obvious levels with likely resting stop orders; London's higher liquidity often reaches them early.
What does New York do after London?
It often continues the London move or reverses it after taking London's high or low, especially around US data releases.
Does this pattern happen every day?
No. It's a common tendency; some days London breaks out and runs, and some days it stays inside the range.
Which timezone should I use for the Asian range?
Use one fixed definition in New York time and convert to IST, adjusting for US daylight saving.
How often does London take the Asian high or low?
In our study of 518 trading days across four markets, London (02:00–05:00 New York) traded beyond the Asian high on 49% of days and below the Asian low on 49%, and stayed inside the range on only 13%.
Does London usually reverse after sweeping the Asian range?
Less often than usually taught. The full pattern of sweeping one side and then reaching the other side by noon New York happened on about 21% of days. When London took one side, New York continued in the same direction about 61% of the time.
Does the Asian range work the same on gold and indices?
The idea, that a quiet overnight range is often tested once more liquid hours begin, can be applied to gold and stock indices, but their quiet and busy hours differ from the major currency pairs. Measure the range and the session behaviour on each market separately rather than assuming the forex pattern carries over.
Practical Exercise
Log 20 trading days.
Your task
Step 1: Mark the Asian range
Each day, on one pair.
Step 2: Classify London
Swept high, swept low, broke out, or stayed inside.
Step 3: Classify New York
Continued, reversed, or ranged.
Step 4: Count
Which combinations were most common in your sample?
Check Your Understanding
A common ICT Asian range window is:
Related Lessons
Previous: ICT Kill Zones in IST. Next: Power of Three. See also Liquidity Sweep vs Displacement.