
The ICT 2022 Mentorship Model: A Step-by-Step Breakdown
JustWolves is an educational platform and is not a SEBI-registered investment advisor. Trading financial instruments involves significant risk of loss and may not be suitable for all investors. Past performance is not indicative of future results. Read our full disclaimer →
What you'll learn
- The 2022 model is a five-step sequence from ICT's widely viewed 2022 mentorship series
- Steps: bias and draw on liquidity, a sweep of liquidity, displacement with an MSS, an FVG entry, and a target at opposing liquidity
- It's typically traded in a kill zone on 1- to 15-minute charts
- It combines concepts from this course rather than adding new ones
- Its clear steps make it straightforward to backtest
In this article · 15 sections
In 2022, ICT published a free mentorship series on YouTube that many traders treat as the clearest summary of his approach. The entry model at its centre, usually called the ICT 2022 model, strings together concepts you've already learned into five steps. This lesson lays out those steps, shows a worked example, and explains what to test before relying on it.
What You Will Learn
- The five steps of the 2022 model
- Timeframes and timing
- Entry, stop and target rules
- How it compares with the Silver Bullet
Before You Start
Read Turtle Soup, Daily and Weekly Bias and Market Structure Shift vs CHoCH first.
The Five Steps
Bullish version
Step 1: 1. Bias and draw on liquidity
Higher-timeframe bias bullish; identify buy-side liquidity above as the target.
Step 2: 2. Liquidity sweep
During a kill zone, price takes sell-side liquidity: a recent low, the Asian low or similar.
Step 3: 3. Displacement and MSS
Price rallies sharply, breaking the most recent short-term high: a market structure shift with displacement.
Step 4: 4. FVG entry
The displacement leaves a fair value gap; enter on the retrace into it.
Step 5: 5. Target
Stop below the sweep low; target the buy-side liquidity identified in step 1.
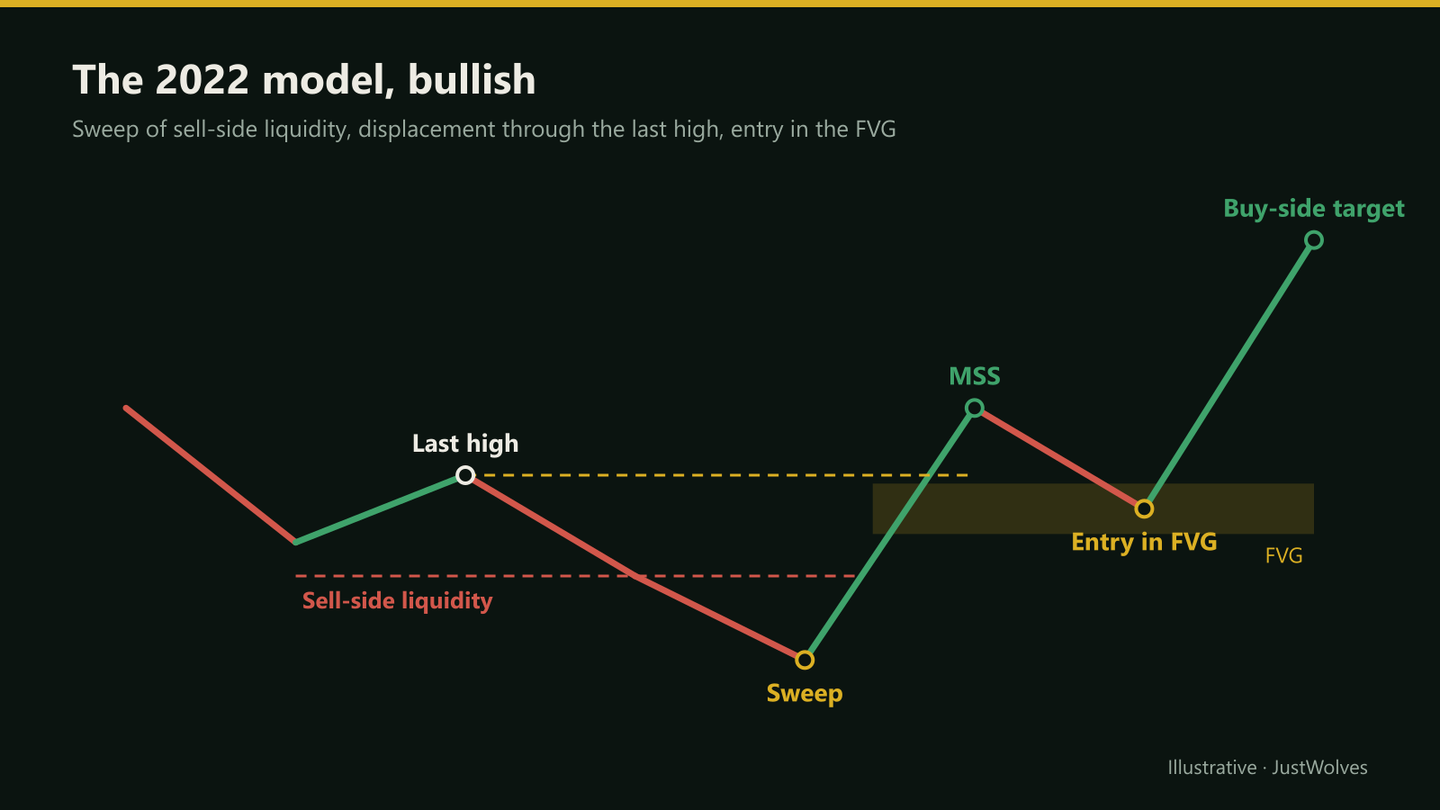
The Five Steps on a Chart
Step through the model below. Each step only becomes visible once the previous one has happened, which is how the model has to be traded in real time.
The 2022 model in five steps
Step 1 of 5
1. Bias and draw on liquidity
The daily bias is bullish, and equal highs at 1.0945 are the draw. The Asian low at 1.0856 is sell-side liquidity below.
- What to observe
- Bias first, before the kill zone.
- Condition
- Only longs today.
Timing and Timeframes
The model is usually traded within a kill zone (lesson 03.02.01): for traders in India, typically the London window in the early afternoon or the New York open in the evening IST.
Bias comes from the daily or 4-hour chart; the sweep, MSS and FVG are read on the 1- to 15-minute chart. Pick one entry timeframe and use it consistently.
Entry, Stop and Target Details
- Entry: a limit order at the near edge or 50% of the FVG. Some traders wait for the first FVG after the MSS only.
- Stop: below the sweep low (bullish) with a buffer; some use the swing low that created the FVG for a tighter stop.
- Target: the draw on liquidity from step 1; partials at intermediate liquidity are common.
- Validity: if price takes out the sweep low before reaching the FVG, the setup is void.
2022 Model vs Silver Bullet
| 2022 model | Silver Bullet | |
|---|---|---|
| Time filter | Kill zone | Three specific one-hour windows |
| Sequence | Sweep → MSS → FVG | Sweep → displacement → FVG |
| Emphasis | Structure shift and draw on liquidity | The time window |
| Trade frequency | Somewhat more | Fewer |
A Mechanical Test of the Model
JustWolves tested a fixed, mechanical version of the 2022 model on about six months of real 1H candles (May–November 2026) for EUR/USD, GBP/USD, USD/JPY and gold. Rules: (1) price sweeps the most extreme high or low of the previous 24 hours; (2) within six candles, a candle closes beyond the high (or low) of the five candles before the sweep, and that move leaves a fair value gap; (3) a limit order at the gap's 50% level, valid for six candles; (4) stop just beyond the sweep extreme. We tested four exit rules on the same setups. There was no separate daily-bias filter: the sweep direction set the trade direction. Costs were excluded.
| Exit rule | Filled | Winning trades | Average per trade |
|---|---|---|---|
| Target the opposite 24-hour extreme | 48% | 43% | +0.02R |
| Fixed 2R target | 58% | 50% | +0.17R |
| Fixed 1R target | 49% | 57% | +0.15R |
| Half at 1R, stop to entry, rest to the opposite extreme | 48% | 54% | +0.06R |
This was the first ICT model in our tests to come out positive on average, and it did so with every exit rule. It needs a careful reading:
- The sample is small. About a hundred filled trades means the true average could easily be zero; a result of +0.17R is not statistically distinguishable from no edge at all.
- Fixed targets beat the "draw on liquidity" target. Aiming for the opposite 24-hour extreme won less often and paid less overall than a simple 2R or 1R target. Many trades moved in the right direction but turned before reaching the far side.
- The sequence seems to matter. In other lessons, the individual pieces (a sweep alone, a CISD alone, a Silver Bullet window alone) were close to break-even or negative. Requiring a sweep and a structure shift and a gap filtered out many weak signals.
Treat this as encouragement to test the model properly on your own market, with your own costs and a larger sample, rather than as proof that it works.
Variations You'll See
Because the model has been retold by many educators, you'll meet several versions. Decide which one you're testing and keep it fixed:
- Which liquidity: some versions require an external level, such as a session high or low, the PDH or PDL; others accept any recent short-term high or low.
- Which entry: the first FVG after the MSS, any FVG in the displacement leg, or an OTE retracement of that leg instead of an FVG.
- Which stop: below the sweep low, or below the swing that created the FVG for a tighter stop.
- Which management: a partial at 1R or at the first internal liquidity, or holding the full position to the draw on liquidity.
Each choice changes the win rate and average win. Testing one fixed version is far more informative than mixing them trade by trade.
Practical Example
Hypothetically, in winter, EUR/USD's daily bias is bullish, with equal highs at 1.0945 as the draw. In the London kill zone, at 1:15 pm IST, price drops below the Asian low at 1.0880 to 1.0874, then rallies through the last 5-minute high at 1.0889 with large candles, leaving an FVG at 1.0882–1.0887.
Tara buys at 1.0886 with a stop at 1.0869, below the sweep low. Her target is 1.0945: 17 pips of risk for 59 pips, about 3.5R. She takes partial profit at the London session high, 1.0912.
Common Mistakes
- Skipping step 1, so sweeps in both directions look like setups.
- Calling any break an MSS without displacement.
- Entering in later FVGs far from the sweep.
- Trading outside kill zones.
- Targets with no liquidity logic.
Professional Insight
The 2022 model is valuable as a template: it forces a sequence of evidence (direction, liquidity taken, structure shift, a defined entry) before every trade. Whether it's profitable for you depends on your pair, timeframe, costs and execution, which only a careful backtest can show.
Risk Considerations
- Low-timeframe stops are vulnerable to spread and news.
- Wrong bias turns valid-looking setups into losses.
- Selective examples online make it look more reliable than any method is.
Important Terminology
| Term | Meaning |
|---|---|
| 2022 model | ICT's five-step entry model from the 2022 mentorship series. |
| Draw on liquidity | The target level price is expected to reach. |
| Sweep | Price taking an obvious level against the bias. |
| MSS | A market structure shift with displacement. |
| FVG entry | A limit order in the gap left by the displacement. |
What is the ICT 2022 model?
A five-step entry model from ICT's 2022 mentorship: bias and draw on liquidity, a liquidity sweep, a displacement MSS, an FVG entry and a liquidity target.
Which timeframe is used for the 2022 model?
Bias from the daily or 4-hour chart; the setup on 1- to 15-minute charts, usually in a kill zone.
Where is the stop in the 2022 model?
Beyond the sweep extreme, with a buffer.
How is it different from the Silver Bullet?
The sequence is similar; the Silver Bullet restricts trades to three specific one-hour windows.
Is the 2022 model profitable?
That depends on your rules, market, costs and execution. Backtest it before trading it.
Does the ICT 2022 model work?
In our mechanical test on six months of real 1H data across four markets, it averaged +0.17R per trade with a fixed 2R target and was positive with every exit rule tested. With about a hundred filled trades the result is not statistically conclusive, so test it on your own market.
What is the best target for the 2022 model?
In our test, fixed targets of 2R or 1R did better than targeting the opposite 24-hour extreme, which won less often and averaged only +0.02R per trade.
Practical Exercise
Run a 2022 model backtest.
Your task
Step 1: Write the five steps
As exact rules, including timeframes and the kill zone.
Step 2: Review 40 sessions
Candle by candle, without hindsight.
Step 3: Record each setup
Valid or not, filled or not, result in R after spread.
Step 4: Evaluate
Win rate, average R, expectancy, longest losing streak.
Check Your Understanding
Step 1 of the 2022 model is:
Related Lessons
Previous: Turtle Soup. Next: Multi-Timeframe ICT Entry and Exit Framework. See also The ICT Silver Bullet.