
CRT with SMC: Liquidity Sweeps and Fair Value Gaps
JustWolves is an educational platform and is not a SEBI-registered investment advisor. Trading financial instruments involves significant risk of loss and may not be suitable for all investors. Past performance is not indicative of future results. Read our full disclaimer →
What you'll learn
- CRT and SMC describe the same event, a sweep and reversal, at different levels of detail
- C2 sweeps of equal highs or lows are among the most commonly watched CRT setups
- Fair value gaps and order blocks near C1's range give the sweep a location
- A fair value gap forming during C3 on a lower timeframe can provide a refined entry
- Each added concept should add independent evidence, not repeat the same idea
In this article · 16 sections
Many traders who use CRT also use Smart Money Concepts, and for good reason: a CRT setup is a liquidity sweep and reversal described at the level of individual candles. SMC adds tools for judging where that sweep happens and how to enter afterwards: equal highs and lows, fair value gaps and order blocks. This lesson shows how to combine the two without simply stacking labels.
What You Will Learn
- How CRT and SMC overlap
- Using equal highs and lows as sweep targets
- Fair value gaps and order blocks as locations
- FVG entries during C3
Before You Start
Read CRT with Market Structure, and from the SMC course, Liquidity Sweeps, Fair Value Gaps and Order Block Trading.
Same Event, Different Lens
| CRT | SMC equivalent |
|---|---|
| C2 trades beyond CRL | Sell-side liquidity sweep |
| C2 closes back inside | Failed break / sweep and reclaim |
| C3 moves toward CRH | Displacement toward buy-side liquidity |
| CRH as target | Opposing liquidity as the draw |
Equal Highs and Lows
When C1's low lines up with earlier equal lows, a C2 sweep below it clears a cluster of stops. Many traders rank these setups above sweeps of a single candle's low, because more traders were watching the level.
Internal vs External: What Did C2 Actually Sweep?
A CRT C2 always sweeps C1's high or low, but those are often minor levels. The chart below shows the difference between a sweep of C1's own low and a sweep that also clears the wider, multi-day low beneath it.
Which liquidity did C2 take? C1 low vs the 3-day low
Step 1 of 5
Mark the wider liquidity first
The lowest low of the last few days, 48.80, is external liquidity: the level that traders on this chart, and on higher timeframes, can see. Stops from several days of trading sit below it.
- What to observe
- The extreme of the recent range, not just the last candle.
- Condition
- Mark it before looking for CRT.
FVGs and Order Blocks as Locations
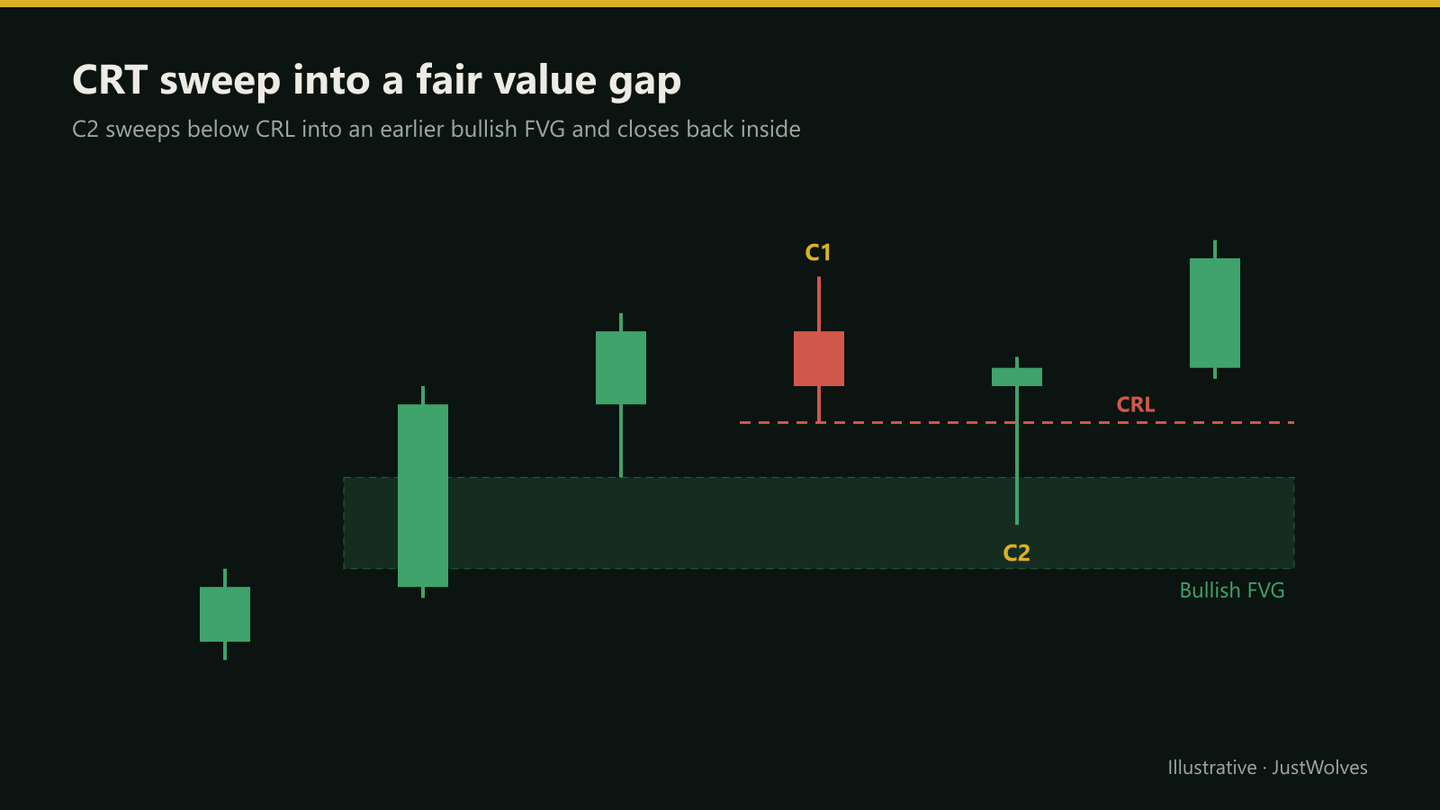
- Fair value gap: if C2's sweep reaches into a higher-timeframe bullish FVG and reverses, the gap adds a reason for buyers to appear there.
- Order block: a sweep into a bullish order block on the higher timeframe adds similar context.
- Premium and discount: a bullish CRT sweep in the lower half (discount) of a larger range is generally preferred to one in the upper half.
FVG Entries During C3
Lower-timeframe refinement
Step 1: Valid C2
On the CRT timeframe, for example 1-hour.
Step 2: Drop down
To a timeframe about four to twelve times smaller, such as 5 or 15 minutes.
Step 3: Wait for displacement
A strong move in the setup's direction that leaves a small FVG.
Step 4: Enter
On a pullback into that FVG.
Step 5: Stop
Beyond the lower-timeframe swing that created the FVG, or beyond C2's extreme for a wider, safer stop.
Order Blocks in CRT
An order block is the last opposite candle before a strong move. In a bullish context, it's the last bearish candle before a sharp rally. When price later returns to that candle's range, some traders expect buyers to defend it again.
In CRT terms, a bullish order block on the higher timeframe is a natural place for C2's sweep to end. If C2 dips into the order block, below CRL, and closes back above CRL, the setup has two independent supports: the failed break of C1's range and the higher-timeframe level. The order block's low then offers a logical place for the stop, sometimes tighter than C2's own extreme.
Keeping the System Testable
Every added condition reduces the number of setups and makes results harder to judge. A practical approach is to start with the plain CRT rules plus trend, record which setups also had an SMC feature, and only add that feature as a requirement if your records show it made a meaningful difference. That way the system grows from evidence rather than from enthusiasm for new concepts.
Which SMC Features Helped in Our Test?
JustWolves tagged 830 real 4H CRT setups (EUR/USD, GBP/USD, USD/JPY and gold, May–November 2026) with three SMC features and compared results. Features: whether C2 also swept the most extreme high or low of the previous 20 candles (about three days, external liquidity); whether it swept the previous day's high or low; and whether C1's swept level lined up with an earlier equal high or low (within 10% of the average candle range). Trade rules were the course standard. Costs were excluded.
| Feature | Setups | Winning trades | Average result |
|---|---|---|---|
| C2 swept the 20-candle (≈3-day) extreme | 158 | 51% | +0.04R |
| C2 swept only C1 | 672 | 43% | −0.08R |
| C2 also swept the previous day's high/low | 270 | 48% | −0.03R |
| C1 level matched an earlier equal high/low | 448 | 44% | −0.09R |
| No equal level at C1 | 382 | 46% | −0.02R |
Two findings are worth carrying into your own testing:
- The size of the liquidity pool mattered more than the label. Sweeps that cleared the multi-day extreme did better than sweeps of C1 alone, and were slightly positive on average. Sweeps of the previous day's high or low fell in between.
- Equal levels did not help here. Setups where C1's level matched an earlier equal high or low did slightly worse. This is a reminder of the warning above: an equal low and a CRT sweep of it are often the same idea described twice, not two independent reasons.
Neither finding is strong enough to build a system on alone. They suggest a direction: judge a CRT setup partly by how much liquidity the sweep cleared, and test that rule rather than adding more labels.
Practical Example
Hypothetically, a pair's 4-hour chart shows a bullish FVG at 1.0820–1.0835 from an earlier rally. A 4-hour C1 runs from 1.0840 to 1.0880. C2 sweeps to 1.0828, into the FVG, and closes at 1.0852.
On the 15-minute chart, early in C3, price displaces up from 1.0848 to 1.0866, leaving a small FVG at 1.0853–1.0858. Vikram buys at 1.0857 on the pullback into it, with a stop at 1.0845 and a target at CRH 1.0880: 12 pips of risk for 23 pips of reward.
Notes on FVG Entries During C3
The lower-timeframe FVG entry described above is one of the most popular CRT refinements. It is also the hardest to test honestly, because it depends on detail inside each 4H candle. We did not test it: it needs several months of 5- to 15-minute data per market, which our data set does not cover. If you use it, three practical points apply:
- The FVG must form after C2 closes. A gap that formed during C2 is part of the sweep, not a confirmation of the reversal.
- Count the trades that never fill. Many C3 moves leave no lower-timeframe gap, or never retrace into it. Those are missed trades, and they belong in your results as zeros.
- Compare against the simple entry. Test the FVG entry on the same setups as an entry at C3's open. The refinement is only worth its extra complexity if it beats the simple version per setup, including misses. See CRT Entry Models.
Common Mistakes
- Stacking labels for the same event.
- Ignoring trend because SMC tools look convincing.
- Using any small FVG without displacement.
- Very tight lower-timeframe stops that sit inside noise.
- Forgetting the C2 close rule while focusing on SMC features.
Professional Insight
Traders who combine CRT and SMC well tend to keep CRT as the backbone (the precise candle rules) and use SMC tools mainly for location and entry refinement. That keeps the system testable while borrowing SMC's useful detail.
Risk Considerations
- Tight stops get hit more often.
- Overfitting with too many conditions.
- FVGs and order blocks fail like any level.
Important Terminology
| Term | Meaning |
|---|---|
| Liquidity sweep | A move beyond a level that triggers resting orders. |
| Fair value gap | A three-candle imbalance left by a fast move. |
| Order block | The last opposite candle before a strong move. |
| Displacement | A strong, fast move in one direction. |
| Discount | The lower half of a range. |
Is CRT part of SMC?
They're separate frameworks that describe the same kind of event; CRT uses strict candle rules, SMC uses liquidity and imbalance concepts.
How do I use FVGs with CRT?
As locations for C2's sweep, or as lower-timeframe entry points during C3.
What timeframe should I use for the FVG entry?
Commonly four to twelve times smaller than the CRT timeframe, such as 15-minute for 4-hour CRT.
Are equal lows better sweep targets?
Many traders rank them highly because more stops cluster beneath repeated lows.
Does adding SMC improve CRT?
Only if it adds independent information; relabelling the same sweep doesn't.
Does sweeping equal lows make a CRT setup stronger?
Not in our test. Of 830 real 4H setups, those where C1's level matched an earlier equal high or low did slightly worse (−0.09R) than those without (−0.02R), before costs. Sweeps of the wider 3-day extreme did somewhat better (+0.04R).
Is a CRT sweep the same as an SMC liquidity sweep?
Yes, they describe the same event. A CRT C2 is a liquidity sweep of one candle's high or low that closes back inside. Counting both labels as separate reasons for a trade double-counts one idea.
Practical Exercise
Combine and compare.
Your task
Step 1: Find twenty CRT setups
On your timeframe.
Step 2: Tag SMC features
Equal lows/highs, FVG or order block at the sweep.
Step 3: Try LTF entries
Note the entry, stop and outcome versus entering at C3's open.
Step 4: Compare
Did tagged setups or LTF entries improve results in your sample?
Check Your Understanding
In SMC terms, C2 trading below CRL is:
Related Lessons
Previous: CRT with Market Structure. Next: CRT with ICT Concepts. See also Fair Value Gaps.