
Candle Range Sweeps and False Breaks
JustWolves is an educational platform and is not a SEBI-registered investment advisor. Trading financial instruments involves significant risk of loss and may not be suitable for all investors. Past performance is not indicative of future results. Read our full disclaimer →
What you'll learn
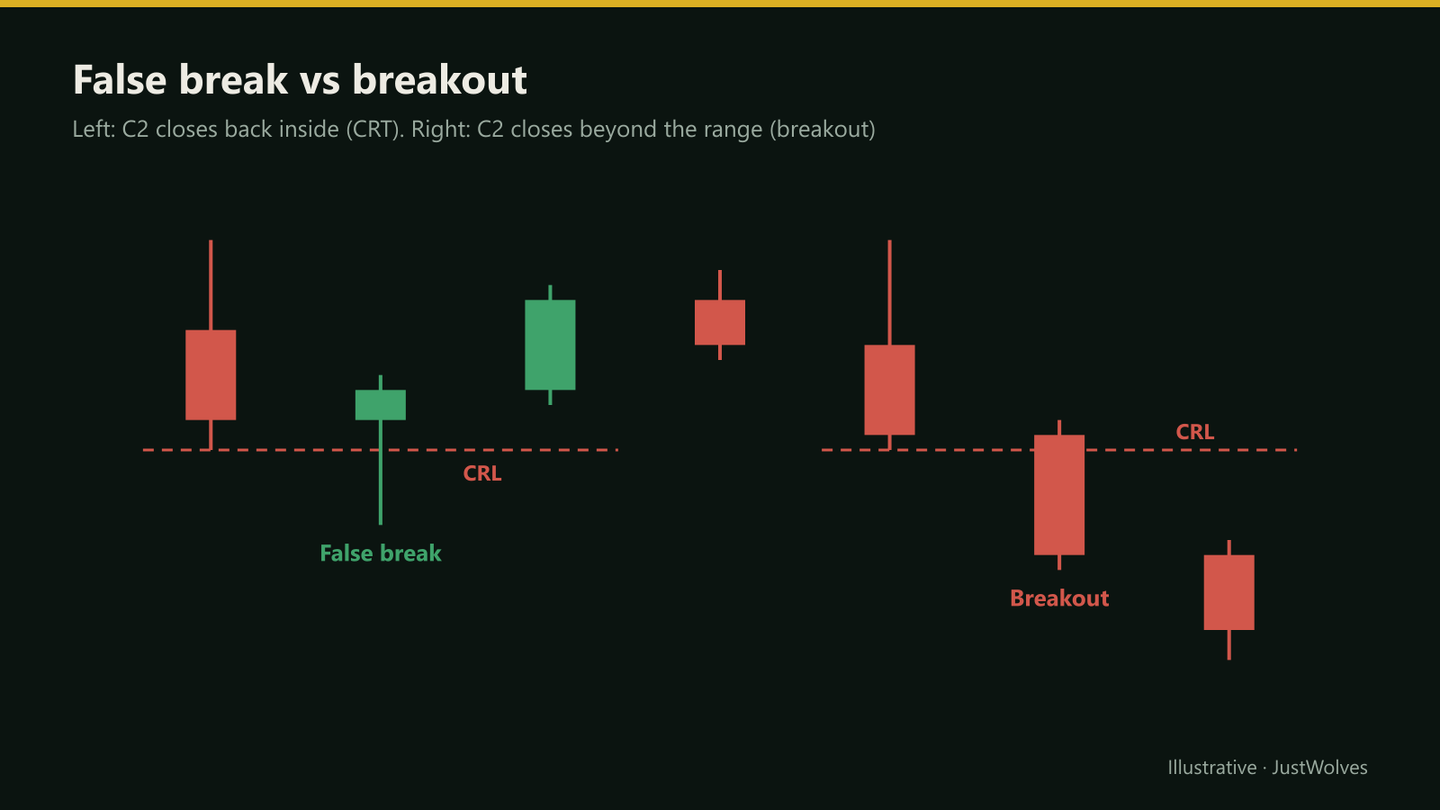
- A sweep trades beyond a candle's range; a false break is a sweep that closes back inside
- The close decides: a close outside the range is a breakout until proven otherwise
- Long wicks and a close well back inside suggest a stronger rejection
- Very deep sweeps or sweeps with strong follow-through often become real breakouts
- Trend and higher-timeframe levels help separate likely false breaks from likely continuations
In this article · 16 sections
Every breakout starts the same way: price trades beyond a level. Some breakouts keep going; others fail and close back inside. CRT is built on the second kind. This lesson focuses on the difference between a sweep that becomes a false break and one that becomes a real breakout, and on the clues that help you tell them apart before committing to a trade.
What You Will Learn
- The difference between a sweep, a false break and a breakout
- What the close of C2 tells you
- Clues in the wick, depth and following candle
- How context changes the odds
Before You Start
Read Liquidity Around Candle Ranges first. The Breakout Trading course covers the same events from the breakout trader's side.
Three Outcomes
| Outcome | C2 close | Meaning |
|---|---|---|
| False break (valid CRT) | Back inside C1's range | The break failed; trapped traders may fuel a move back across |
| Breakout | Beyond C1's range | The break held; no CRT setup |
| No sweep | Inside, never traded beyond | Nothing to trade under this model |
The Close Decides
During C2, price might trade well below CRL and look like a breakdown. Halfway through the period, it might be back inside and look like a false break. Only the close settles which it is under this model.
That's why CRT entries come after C2 closes, at the start of C3 or later. Entering during C2 means guessing an outcome that hasn't happened.
How Often Does an Early Read Hold?
If the close decides, how much does an early read tell you? JustWolves measured it on real data: every 4H candle on EUR/USD, GBP/USD, USD/JPY and gold (May–November 2026) that, two hours into the candle, was trading beyond the previous candle's high or low.
| Outcome when the 4H candle closed | Candles | Share |
|---|---|---|
| Closed back inside the previous candle (became a CRT C2) | 229 | 21% |
| Did not close back inside (breakout or other) | 842 | 79% |
Four out of five candles that were beyond the level at the halfway mark did not end up as CRT setups. Acting early is not a slightly riskier version of the same trade. It is a different trade, and in this sample it was usually the wrong one. The real example below shows how convincing a half-finished C2 can look.
Real case: it looked like a sweep two hours in. Gold 1H, 12 November 2026
Step 1 of 5
C1: the 21:00 New York 4H candle
Shown here as its four hourly candles. C1 ranged from 3974.6 (CRL) to 3995.3 (CRH).
- What to observe
- Four hours make one C1.
- Condition
- Mark CRH and CRL once the 4H candle closes.
Clues Within C2
- Close location: a close well back inside, especially past C1's midpoint, shows a stronger rejection than a close just inside CRL.
- Wick length: a long wick beyond the range with a body back inside resembles a pin bar, a classic rejection shape.
- Sweep depth: a shallow sweep just beyond the level fits a stop-run; a very deep move suggests genuine selling or buying that may return.
- Volume (where available): high volume on a sweep that fails can indicate many orders were absorbed.
Does Sweep Depth Matter?
How far C2 travels beyond C1 is one of the clues traders read. We grouped 799 valid 4H CRT setups by how far C2 swept beyond CRH or CRL, as a share of C1's range. All used the same trade rules: entry at C3's open, stop beyond C2, target at the opposite side of C1. Costs were excluded.
| Sweep depth beyond C1 | Setups | Winning trades | Average result |
|---|---|---|---|
| Shallow (under 10% of C1's range) | 224 | 38% | −0.17R |
| Medium (10–30%) | 318 | 43% | −0.05R |
| Deep (over 30%) | 257 | 52% | −0.01R |
The pattern was consistent: the deeper the sweep, the better the results, although none of the groups was positive before costs. A shallow poke a few pips beyond CRL barely tests the liquidity below it, and those setups did clearly worst. A deep sweep, which ran well through the level and still closed back inside, shows a much stronger rejection.
The trade-off is the stop. Deeper sweeps mean the stop beyond C2 sits further away, so the reward to the opposite side of C1 is smaller in R terms. That is why deep sweeps won more often without paying much more on average.
The Candle After
C3's early behaviour is the first test. If C3 trades back beyond the level C2 swept and closes there, the false break has itself failed, and the market may be breaking out after all.
Many CRT traders treat a C3 close beyond C2's extreme as invalidation, and a C3 that holds above CRL (in a bullish case) as confirmation that the false break is holding.
Context Clues
- Trend: sweeps against the higher-timeframe trend's direction (a sweep below support in an uptrend) more often fail and reverse.
- Level: sweeps of widely watched levels, such as the previous day's low, carry more weight.
- Session: sweeps in quieter periods that reverse as a more active session opens are a common pattern.
- News: sweeps caused by major news may reflect real repricing rather than a stop-run.
Timeframe Matters
A false break on the 5-minute chart may be invisible on the hourly chart, and a false break of a daily candle may contain several genuine intraday breakouts. Judge the sweep on the timeframe you chose for C1, and treat lower-timeframe noise as detail rather than as a separate signal.
Practical Example
Hypothetically, in a daily uptrend, a stock's 1-hour C1 runs from ₹1,240 to ₹1,256. C2 drops to ₹1,232 and closes at ₹1,251, above C1's midpoint of ₹1,248, leaving a long lower wick. Volume on C2 is about double the recent average.
Kiran treats it as a strong false break in the trend's direction. He enters early in C3 at ₹1,252 with a stop below ₹1,231 and a target at CRH ₹1,256 and beyond. C3 holds above ₹1,240, and price reaches ₹1,268 over the next three hours.
Write Two Plans Before C2 Closes
The cleanest way to handle the sweep-or-breakout question is to stop trying to answer it early. Before C2 closes, write both plans:
- If C2 closes back inside C1: the CRT plan. Entry model, stop beyond C2's extreme, target at the opposite side of C1, minimum reward-to-risk.
- If C2 closes beyond C1: the breakout plan, or simply "no trade". Many CRT traders choose no trade, which is a perfectly good plan.
When C2 closes, you only have to look up which plan applies. The decision was made when you were calm, before the candle's movement had any emotional pull. The breakout side is covered in the Breakout Trading course.
Common Mistakes
- Entering during C2.
- Treating any wick beyond the level as a false break.
- Ignoring deep sweeps that look like real selling.
- Fading strong trends with every sweep.
- Forgetting to check C3 for invalidation.
Professional Insight
Many experienced traders see false breaks and breakouts as two sides of one event. They prepare for both: a CRT plan if C2 closes inside, a breakout plan if it closes outside. Deciding in advance removes the temptation to guess mid-candle.
Risk Considerations
- False breaks can fail in turn.
- Deep sweeps create wide stops.
- News candles distort the pattern.
Important Terminology
| Term | Meaning |
|---|---|
| Sweep | Trading beyond a level. |
| False break | A sweep that closes back inside the range. |
| Breakout | A move beyond a level that closes and holds outside. |
| Sweep depth | How far beyond the level price traded. |
| Invalidation | Price action that cancels the setup. |
What is a false breakout?
A move beyond a level that fails and closes back inside the range.
How do I tell a false break from a real breakout?
Wait for the candle to close. Inside the range suggests a false break; outside suggests a breakout. Wick, depth and context add evidence.
What invalidates a CRT setup after C2?
Many traders treat a later candle closing beyond C2's extreme as invalidation.
Are deep sweeps good CRT setups?
Usually less reliable; deep moves often reflect real buying or selling and can turn into breakouts.
Should I trade CRT against strong trends?
It's riskier, because sweeps in a trend's direction more often become breakouts.
Can I enter a CRT trade before C2 closes?
You can, but it is a different and much riskier trade. In our test, 79% of 4H candles that were beyond the previous candle's high or low two hours in did not close back inside, so they never became CRT setups at all.
Are deeper sweeps better in CRT?
In our test of 799 real 4H setups, deeper sweeps (over 30% of C1's range) won more often and had a better average result than shallow ones, though none of the groups was profitable before costs. Deeper sweeps also mean wider stops.
Practical Exercise
Classify fifty sweeps.
Your task
Step 1: Find fifty sweeps
Of 1-hour candle ranges on one market.
Step 2: Classify each
False break or breakout by C2's close.
Step 3: Record clues
Close location, wick length, depth and trend direction.
Step 4: Compare
Which clues best separated the two outcomes in your sample?
Check Your Understanding
A sweep that closes back inside C1's range is:
Related Lessons
Previous module: Liquidity Around Candle Ranges. Next: Reclaim, Rejection and Continuation of a Range. See also Liquidity Sweeps.