
The Reference Candle: Range High and Range Low
JustWolves is an educational platform and is not a SEBI-registered investment advisor. Trading financial instruments involves significant risk of loss and may not be suitable for all investors. Past performance is not indicative of future results. Read our full disclaimer →
What you'll learn
- C1's high (CRH) and low (CRL) define the range; wicks count, bodies don't decide it
- The midpoint of C1's range (50%) is a useful reference for premium and discount within the range
- Higher-timeframe C1 candles (4-hour, daily) produce more meaningful ranges than very short ones
- Very small or very large C1 candles tend to produce poor setups
- C1 at a meaningful level gives the whole setup more context
In this article · 17 sections
Every CRT setup starts with the reference candle, C1. Its high and low become the levels the next candles test, and its size decides how far a trade can travel and how wide the stop will be. This lesson covers how to mark C1 correctly, how to use its midpoint, which timeframes produce useful reference candles, and which candles are better skipped.
What You Will Learn
- How to mark CRH and CRL
- How to use the range midpoint
- Which timeframe's candles to use as C1
- How to filter out poor reference candles
Before You Start
Read What Is Candle Range Theory? first.
Marking C1
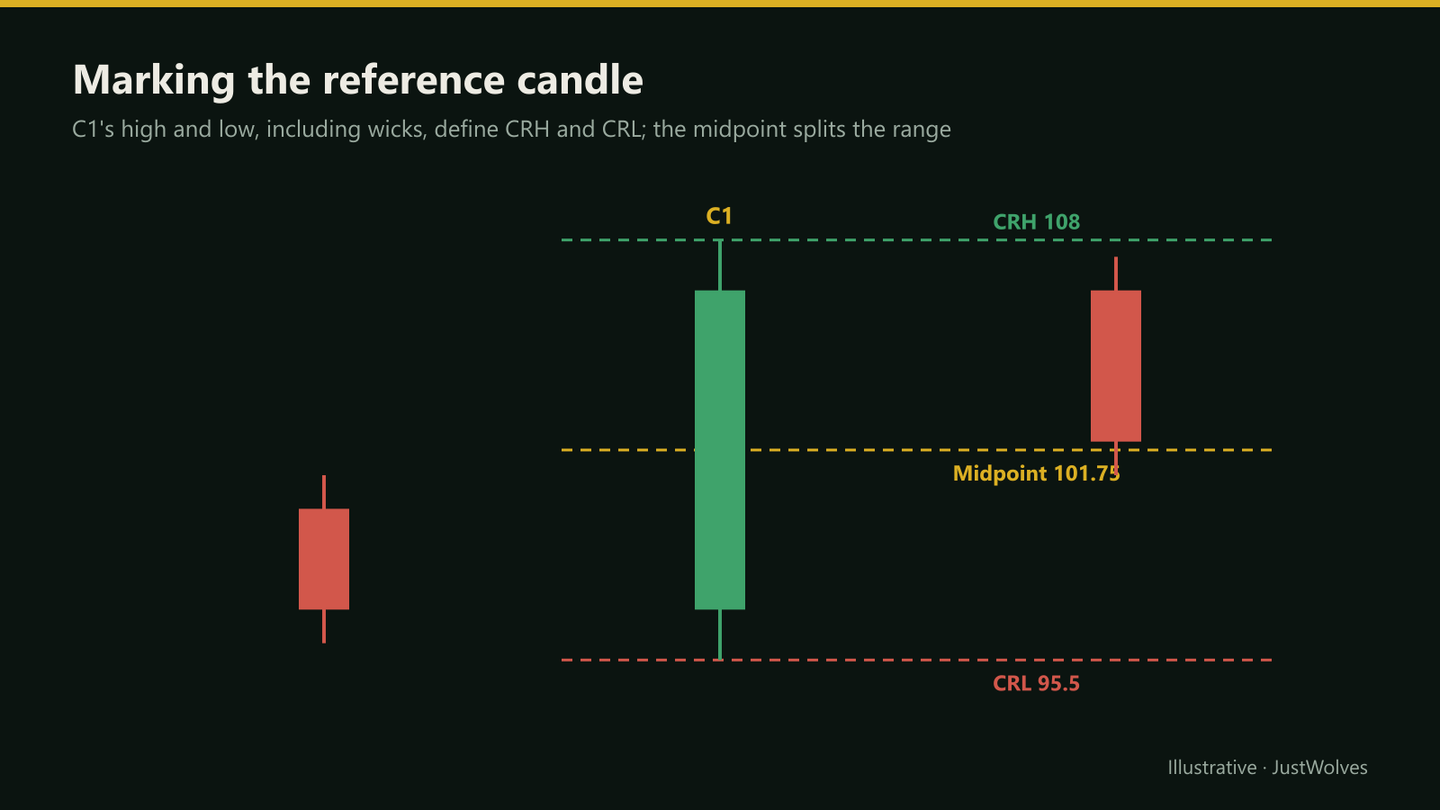
- CRH: the highest price C1 traded, including the upper wick.
- CRL: the lowest price C1 traded, including the lower wick.
- Colour and body: irrelevant to the levels. A bullish, bearish or doji candle can all serve as C1.
Draw horizontal lines at CRH and CRL and extend them to the right. Many traders also mark the midpoint.
Practise Choosing C1
Choosing C1 is where most of the judgement in CRT lives. The chart below compares two candidates on the same chart: one too small to be useful, and one of normal size sitting on a higher-timeframe level. Step through it and decide for yourself which candle deserves CRH and CRL lines before the chart tells you.
Choosing the reference candle
Step 1 of 5
Start with the level, not the candle
Before looking for a C1, mark the higher-timeframe level price is approaching: here, a daily support zone around 97.10–97.50.
- What to observe
- Where would a sweep actually mean something?
- Condition
- No level, no reason to watch for CRT here.
The Midpoint
The midpoint is halfway between CRH and CRL. Above it, price is in the upper half (premium) of C1's range; below it, the lower half (discount).
In a bullish CRT, a C2 that closes back inside but stays below the midpoint has recovered only a little of the range; one that closes above the midpoint shows a stronger rejection of the sweep. The midpoint also serves as an intermediate target before the opposite side of the range.
Choosing the Timeframe
| C1 timeframe | Character | Typical use |
|---|---|---|
| Daily | Few, large ranges; levels watched by many | Swing trading |
| 4-hour | Balanced frequency and size | Swing and intraday |
| 1-hour | Frequent setups; more noise | Intraday |
| 15-minute and below | Very frequent; often noise | Entry refinement rather than C1 |
For Nifty and Bank Nifty, the 1-hour and daily candles are common choices; for forex, the 1-hour and 4-hour. Choose one timeframe for C1 and keep it consistent while testing.
Candles to Skip
- Very small ranges: a sweep of a tiny range rarely moves far, and costs eat the target.
- Very large ranges: often news candles; the stop becomes too wide and the opposite side too far away.
- Gap candles in stocks: the range may not reflect where most trading happened.
- Candles mid-range on the chart: no meaningful level behind them.
What Our Data Says About C1 Size
The size filter above is common advice. JustWolves tested it on 799 real 4H CRT setups (EUR/USD, GBP/USD, USD/JPY and gold, May–November 2026). We compared each C1's range with the average range of the previous 14 candles. Every setup used the same rules: entry at C3's open, stop 5% of C1's range beyond C2's extreme, target at the opposite side of C1, trades closed after C4. Costs were excluded.
| C1 size vs 14-candle average | Setups | Winning trades | Average result |
|---|---|---|---|
| Small (under 0.75×) | 254 | 51% | −0.01R |
| Normal (0.75–1.5×) | 453 | 39% | −0.14R |
| Large (over 1.5×) | 92 | 53% | +0.12R |
The results do not support the usual rule of skipping large C1 candles. In this sample, large C1s were the only group with a positive average, and normal-sized ones were the weakest. Small C1s were close to break-even before costs. But small ranges also mean small stops, so a fixed spread costs a larger share of each trade, which pushes them clearly negative in practice.
Treat this as a reason to test the size filter on your own market rather than adopt it, or its opposite, on trust. Ninety-two trades is far too few to conclude that large C1s are better. What the data does show is that size alone is not a reliable quality filter.
C1 at Meaningful Levels
A C1 whose low sits on a prior swing low, a support zone or a round number has extra liquidity below it, and a sweep of it has more context. A C1 floating in the middle of a range has little behind it. That's why the step-by-step routine in the original CRT model starts with marking key levels before looking for C1.
When C1 Is Still Forming
C1 is only complete when its period closes. Until then, its high and low can still change, so CRH and CRL aren't fixed. Mark the levels after the candle closes, not during it.
The same applies across timeframes. If you use a 4-hour C1, the 4-hour candle must close before its range is final; watching the 15-minute chart during that period only shows the range being built. Many traders set an alert at each candle close on their C1 timeframe and mark levels then, which also removes the temptation to anticipate setups.
Session and Exchange Timing
Candle boundaries depend on your platform's settings. A daily Nifty candle covers the NSE session from 9:15 am to 3:30 pm IST, while a 'daily' forex candle often closes at 5 pm New York time. Hourly Nifty candles may start at 9:15 rather than on the hour. Check your chart's session settings so that the C1 you mark matches the candle other traders are watching.
Practical Example
Hypothetically, a 1-hour Nifty candle runs from 24,040 to 24,110, a range of 70 points, while the average hourly range recently is about 60 points. Its low sits just above yesterday's low at 24,030. Rohit marks CRH 24,110, CRL 24,040 and a midpoint of 24,075.
The next candle sweeps to 24,018 (below both CRL and yesterday's low) and closes at 24,082, above the midpoint. He grades the setup as stronger than one closing just above CRL.
Four Ways Traders Use the Midpoint
The midpoint of C1 is the most underused level in the model. It helps at four points in a trade:
- Grading C2. A C2 that closes beyond the midpoint (above it for a bullish setup) shows a stronger rejection than one that closes just inside CRL. In our data, setups with such a close won more often (61% vs 41%), though the closer target meant the average result barely changed.
- A first target. Taking part of the position at the midpoint banks something on setups that stall halfway, which is common.
- Managing the stop. Moving the stop to entry once the midpoint is reached turns many would-be losers into scratches.
- Early warning. If price reaches the midpoint and then closes back beyond the swept level, the setup's logic has weakened.
The midpoint is also the dividing line between the upper (premium) and lower (discount) halves of C1. That link to the wider SMC framework is covered in Premium and Discount.
Practise marking C1 on gold 4H candles
Loading historical candles…
Common Mistakes
- Using bodies instead of wicks for CRH and CRL.
- Switching timeframes between setups.
- Using tiny or huge C1 candles.
- Ignoring where C1 sits relative to key levels.
- Forgetting the midpoint as a strength check.
Professional Insight
Experienced CRT traders spend most of their effort choosing good C1 candles, at the right size and at meaningful levels. Once the reference candle is well chosen, the rest of the model is mechanical.
Risk Considerations
- Large ranges mean large stops.
- Small ranges may not cover costs.
- Session gaps can distort daily ranges.
Important Terminology
| Term | Meaning |
|---|---|
| Reference candle | C1, whose range defines the setup. |
| CRH | C1's high, including the wick. |
| CRL | C1's low, including the wick. |
| Midpoint | Halfway between CRH and CRL. |
| Range filter | A rule comparing C1's size with recent candles. |
What is the reference candle in CRT?
C1, whose high and low define the range the next candles react to.
Do wicks count for CRH and CRL?
Yes. CRH is the highest price C1 traded and CRL the lowest, including wicks. Using bodies changes which C2 candles count as sweeps and makes the model inconsistent.
What is the CRT midpoint?
Halfway between CRH and CRL, used to judge how strongly C2 closed back inside.
Which timeframe is best for C1?
Many traders use 1-hour, 4-hour or daily candles. Consistency matters more than the exact choice.
Which candles make poor C1s?
Very small or very large ranges, gap candles and candles with no nearby level.
Should I skip large C1 candles in CRT?
It is common advice, but our test of 799 real 4H setups did not support it: large C1 candles (over 1.5× the average range) had the best average result, although the sample was small. Size alone was not a reliable filter. Test it on your own market.
Practical Exercise
Grade twenty C1 candles.
Your task
Step 1: Choose a timeframe
1-hour or 4-hour.
Step 2: Mark twenty C1s
With CRH, CRL and midpoint.
Step 3: Apply filters
Size relative to average and location at a level.
Step 4: Track C2
Which filtered C1s produced valid sweeps?
Check Your Understanding
CRL is:
Related Lessons
Previous: What Is Candle Range Theory?. Next: Range Formation and Range Expansion.