
Liquidity Around Candle Ranges
JustWolves is an educational platform and is not a SEBI-registered investment advisor. Trading financial instruments involves significant risk of loss and may not be suitable for all investors. Past performance is not indicative of future results. Read our full disclaimer →
What you'll learn
- Stop-loss and breakout orders tend to cluster just beyond obvious highs and lows
- A candle's high and low attract more orders when they line up with swing points, equal highs or lows, or session extremes
- A sweep triggers those orders; if price then closes back inside, trapped traders can fuel the opposite move
- Higher-timeframe and session ranges usually hold more liquidity than small intraday candles
- Liquidity explains why CRT can work; it doesn't guarantee that any single sweep reverses
In this article · 16 sections
CRT works, when it works, because of where orders sit. Traders place stop-losses and breakout orders just beyond obvious highs and lows, including the highs and lows of individual candles. A sweep through those levels triggers the orders; a close back inside leaves many of those traders on the wrong side. This lesson explains where liquidity tends to cluster around candle ranges and how to judge which ranges matter most.
What You Will Learn
- Why orders cluster beyond candle highs and lows
- Which candle ranges hold the most liquidity
- How sweeps interact with that liquidity
- The limits of liquidity-based reasoning
Before You Start
Read Range Formation and Range Expansion, and from the SMC course, Liquidity and Equal Highs and Equal Lows.
Why Orders Cluster
- Stop-losses: traders long from inside a range often place stops just below its low; shorts place stops just above its high.
- Breakout orders: traders waiting for a breakout place buy-stops above highs and sell-stops below lows.
- Obvious levels attract more: the clearer a high or low looks, the more traders use it.
These orders are what the SMC course calls liquidity. When price reaches them, they're triggered, adding buying above highs and selling below lows.
Which Ranges Hold More Liquidity
| Range | Why |
|---|---|
| Previous day's high and low | Watched by many intraday traders |
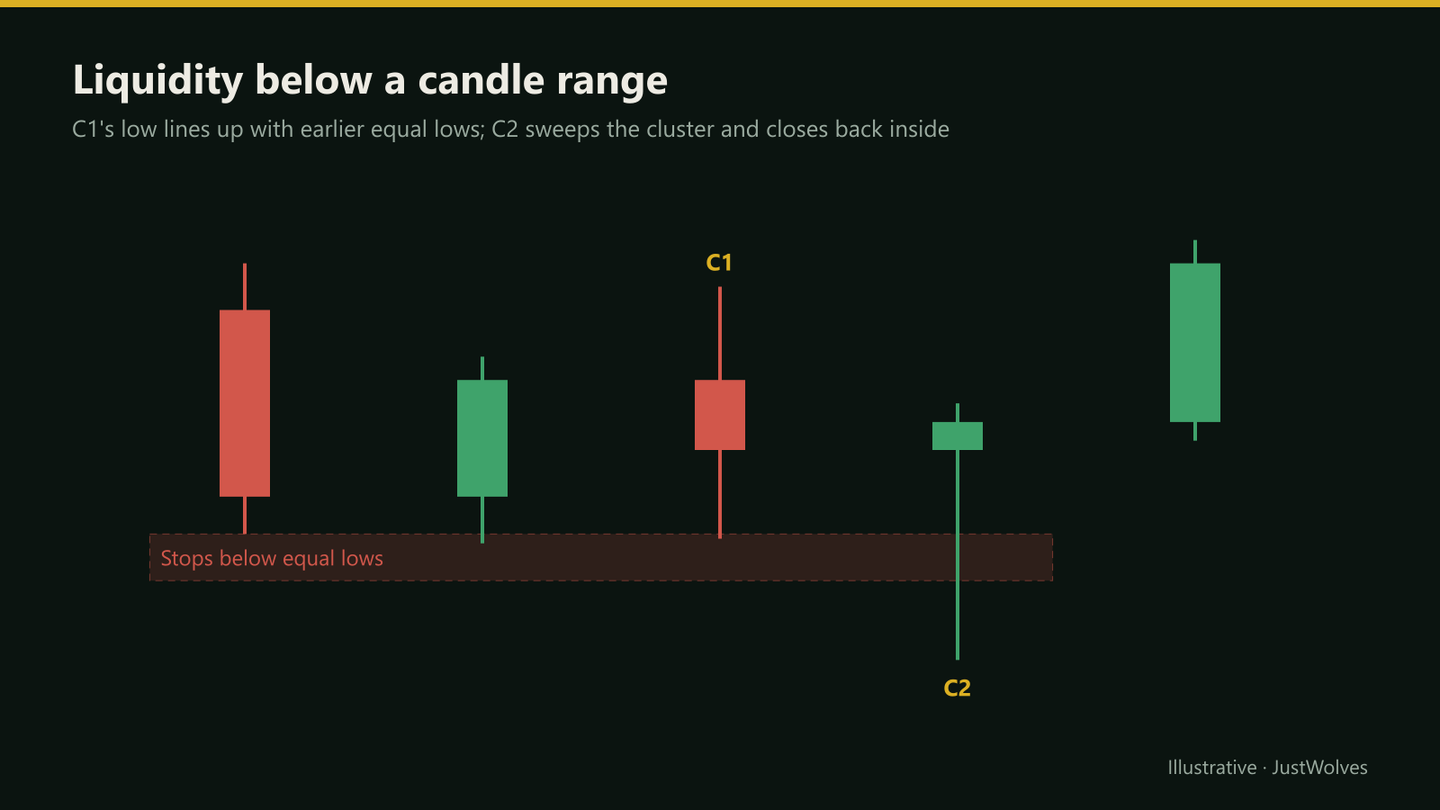
| Equal highs or lows near C1's extremes | Repeated tests concentrate stops |
| Session ranges (for example, the Asian session in forex) | Commonly used reference points |
| Higher-timeframe candles (daily, 4-hour) | More participants use them |
| Small intraday candles | Fewer orders; more noise |
How Sweeps Use Liquidity
When price trades below CRL, sell-stops are triggered: long traders exit and breakout sellers enter. Those sales supply liquidity to anyone who wants to buy. If buyers absorb that selling and price closes back above CRL, the breakout sellers are trapped short and the stopped-out longs are out of the market.
Trapped traders who cover, and new buyers reacting to the failed break, can add to the move back across the range. That's the logic behind CRT's target at the opposite side.
How Often Is a Candle's Range Taken?
To see how much liquidity around a single candle actually gets used, JustWolves measured what the next candle did on about 12,000 real 4H candles (EUR/USD, GBP/USD, USD/JPY and gold, two years of data).
| Next candle | Share |
|---|---|
| Traded above the previous candle's high | 49% |
| Traded below the previous candle's low | 46% |
| Traded beyond both (outside candle) | 13% |
| Stayed inside (inside candle) | 17% |
| Traded beyond one side and closed back inside (a valid CRT C2) | 29% |
Two things stand out. First, a single candle's high and low are taken very often, by roughly every other candle. That fits the idea that liquidity rests there. But it also means a sweep of one candle's range is an ordinary event, not a rare signal.
Second, almost three in ten 4H candles form a valid CRT C2. On one market and one timeframe, that is several setups a day. If CRT were a signal by itself, results would be easy. The CRT study in What Is Candle Range Theory? shows it is not. This is why the ranking table above matters: the value lies in choosing the few ranges many participants care about, such as the previous day's range, the session range or a multi-day extreme. In our tests, sweeps of wider levels did better than sweeps of a single candle's range.
Practise ranking ranges: GBP/USD 4H
Loading historical candles…
Liquidity on Both Sides
Every range has orders on both sides: below CRL and above CRH. A sweep of one side uses up the orders there, which is part of why CRT targets the opposite side, where orders are still resting. If both sides of a range have already been swept, the range has less liquidity left to attract price, and later setups using it tend to be weaker.
That's also why many traders prefer the first sweep of a fresh level. A low that has already been swept two or three times has fewer orders left beneath it, and the failed-break logic carries less weight each time.
When both pools are taken: an outside candle is not a CRT
Step 1 of 3
Liquidity on both sides of C1
C1 runs from 19.60 to 20.60. Sell stops rest below it and buy stops above it.
- What to observe
- Two pools, one on each side.
- Condition
- CRT needs C2 to take one of them and fail.
Liquidity and Volume
On exchange-traded markets such as Nifty futures, a sweep that triggers many orders often shows up as a spike in volume on C2. A sweep on unusually light volume may simply reflect thin trading rather than a meaningful clearing of orders. In spot forex, where only tick volume is available, this check is less reliable but still sometimes useful.
Practical Example
Hypothetically, Bank Nifty has made three hourly lows between 51,980 and 51,995 during the morning. The 1 pm candle (C1) has a low of 51,990. At 2 pm, C2 drops to 51,920, through the equal lows, then closes at 52,040.
Arvind treats it as a sweep of the equal-low liquidity and a valid bullish CRT. He considers a long with a stop below 51,920 and a target at C1's high of 52,140.
A Daily Ranking Routine
Turning "focus on important ranges" into a routine takes about five minutes before your session:
- Mark the previous day's high and low. These are the most widely watched levels. In our data, the next day traded beyond at least one of them about 85% of the time.
- Mark the current session's range (for example the Asian range before London). Note whether it is wider or narrower than usual.
- Mark the nearest multi-day extreme on your CRT timeframe, such as the lowest low and highest high of the last three days.
- Note where they cluster. A C1 whose low sits on the previous day's low, or near the 3-day low, puts several layers of stops in one place.
- Only watch C2 sweeps at those levels. Everything else is one of the many ordinary sweeps that happen every day.
The aim is to cut the roughly three-in-ten candles that form a valid C2 down to the handful that sweep something many traders care about.
The Psychology of Seeing Liquidity Everywhere
Once you learn to see liquidity, every high and low starts to look like a target and every wick like a sweep. That feeling is accurate in a sense, because ranges really are taken constantly. But it leads to overtrading. The discipline is not in spotting liquidity; it is in ignoring most of it. If you find yourself taking more than one or two CRT setups a day on a single 4H chart, you are probably trading the ordinary sweeps rather than the meaningful ones.
Common Mistakes
- Believing you know exactly where orders are.
- Treating every candle low as a liquidity pool.
- Ignoring higher-timeframe ranges in favour of small candles.
- Entering on the sweep instead of after the close.
- Assuming trapped traders always fuel a reversal.
Professional Insight
Experienced traders focus CRT on ranges that many participants are watching: the previous day, the current session, equal highs and lows. Sweeps of those levels involve more orders, and their failure is more meaningful, than sweeps of arbitrary small candles.
Risk Considerations
- Sweeps can become real breakouts.
- Order locations are inferred, not known.
- Thin markets produce erratic sweeps.
Important Terminology
| Term | Meaning |
|---|---|
| Liquidity | Resting orders, often clustered beyond obvious levels. |
| Sweep | A move through a level that triggers resting orders. |
| Trapped traders | Traders positioned in the direction of a failed break. |
| Equal lows | Repeated lows at about the same price. |
| Session range | The high and low of a trading session. |
Why does liquidity sit beyond candle highs and lows?
Stop-loss and breakout orders are commonly placed just beyond obvious levels.
Which candle ranges matter most?
Those many traders watch: previous day's high and low, session ranges, and highs or lows that line up with equal highs or lows.
What happens to traders in a failed sweep?
Breakout traders are left on the wrong side, and stopped-out traders are no longer in the market.
Can I see where liquidity is?
Not directly. Its location is inferred from obvious levels.
Does every sweep reverse?
No. Many become genuine breakouts, which is why CRT requires a close back inside and a stop.
How common are CRT setups?
Very common. In our study of 12,344 real 4H candles, about 29% traded beyond one side of the previous candle and closed back inside, which is a valid CRT C2. That is why selecting which ranges to trade matters more than spotting the pattern.
What is an outside candle in CRT?
A candle that trades beyond both the high and the low of the previous candle. It takes liquidity on both sides, so it is not a valid CRT C2. In our data about 13% of 4H candles were outside candles.
Practical Exercise
Rank candle ranges by liquidity.
Your task
Step 1: Mark ranges
Previous day, today's session, equal highs/lows and recent hourly candles.
Step 2: Watch sweeps
Note every sweep of these levels for a week.
Step 3: Apply the CRT rule
Which closed back inside?
Step 4: Compare
Did sweeps of widely watched levels behave differently?
Check Your Understanding
Stop-losses for long positions often sit:
Related Lessons
Previous: Range Formation and Range Expansion. Next module: Candle Range Sweeps and False Breaks. See also Liquidity.