
Bid, Ask and Spread: What Every Forex Trade Really Costs
JustWolves is an educational platform and is not a SEBI-registered investment advisor. Trading financial instruments involves significant risk of loss and may not be suitable for all investors. Past performance is not indicative of future results. Read our full disclaimer →
What you'll learn
- The bid is the price you can sell at; the ask is the price you can buy at
- The spread is the gap between them, and every trade starts that far in the red
- Spreads widen when liquidity is thin: around news, at the daily rollover and at the weekly open
- Some accounts charge a wider spread; others a tight spread plus commission
- The smaller your target, the bigger the share of it the spread takes
In this article · 16 sections
Look closely at any forex quote and you'll see two prices, not one. The difference between them is the spread, the most basic cost of trading. It's easy to ignore because it's small, but you pay it on every single trade, and for short-term traders it can be the difference between a profitable strategy and a losing one.
What You Will Learn
- What the bid and ask prices are and which one you trade at
- How to measure the spread and convert it into money
- Why spreads change through the day
- How spread and commission compare, and why spread matters most for small targets
Before You Start
Read What Is a Pip in Forex? first. Spreads are measured in pips.
Bid and Ask
Every quote has two sides. The bid is the price at which the market will buy from you, so it's the price you sell at. The ask (or offer) is the price at which the market will sell to you, so it's the price you buy at. The ask is always higher than the bid.
If EUR/USD shows 1.08497 / 1.08509, you can sell at 1.08497 or buy at 1.08509. Charts usually plot the bid, which is why a buy order can fill slightly above the price you see on the chart.
The Spread
The spread is ask minus bid. Here, 1.08509 − 1.08497 = 0.00012, or 1.2 pips. It's the dealer's compensation for providing a price, and it's a cost to you.
If you buy and immediately sell, you lose the spread. That means every trade starts slightly negative: a long position has to rise by the spread before it breaks even. On a standard lot of EUR/USD, a 1.2-pip spread costs $12; on a micro lot, $0.12.
Why Spreads Change
Most brokers offer variable spreads that move with market conditions. Spreads are usually tightest when liquidity is deepest, during the London and New York sessions in major pairs, and they widen when liquidity thins:
- Around major news, such as central bank decisions or key data releases.
- At the daily rollover, around the end of the New York trading day, when liquidity briefly drops.
- At the weekly open on Monday morning in Asia.
- In exotic pairs and minors, at most times.
- During market stress, when dealers widen prices to protect themselves.
Some brokers offer fixed spreads, which don't change with conditions but are usually wider on average, and may come with re-quotes in fast markets.
Real Data: The Same Spread on a Quiet Hour and a Busy One
Candles show traded prices, not the spread, but they show how much the market moved in each hour, which is what the spread has to be measured against. The chart below uses real hourly EUR/USD candles for 2 October 2026, in IST.
Real data: a 2.5-pip hour and a 42-pip hour, EUR/USD, 2 October 2026
Step 1 of 4
The quiet hours
From 00:30 to 10:30 IST on 2 October 2026, EUR/USD moves within 24 pips in total, and single hours are tiny: the 03:30 candle spans just 2.5 pips. A 1.2-pip spread is almost half of that hour's whole range, and Kavya's 6-pip scalp target from this lesson could not have been reached inside it.
- What to observe
- The spread is large compared with the movement.
- Condition
- Short-term trades here pay a heavy cost.
Spread or Commission?
| Spread-only account | Raw spread + commission | |
|---|---|---|
| How you pay | A wider spread, no separate fee | A very tight spread plus a fixed commission per lot |
| Easy to see? | The cost is hidden in the price | The commission appears separately |
| Compare by | Spread × pip value | Spread × pip value + commission, per round trip |
To compare two accounts fairly, convert both to total cost per round trip on the same position size. On Indian exchanges the order book shows the bid and ask directly, and costs come from the spread plus brokerage, exchange and regulatory charges and taxes.
Why Small Targets Suffer Most
The spread is a fixed cost per trade, so its impact depends on how much you're trying to make. Here is a 1.2-pip spread as a share of three different targets:
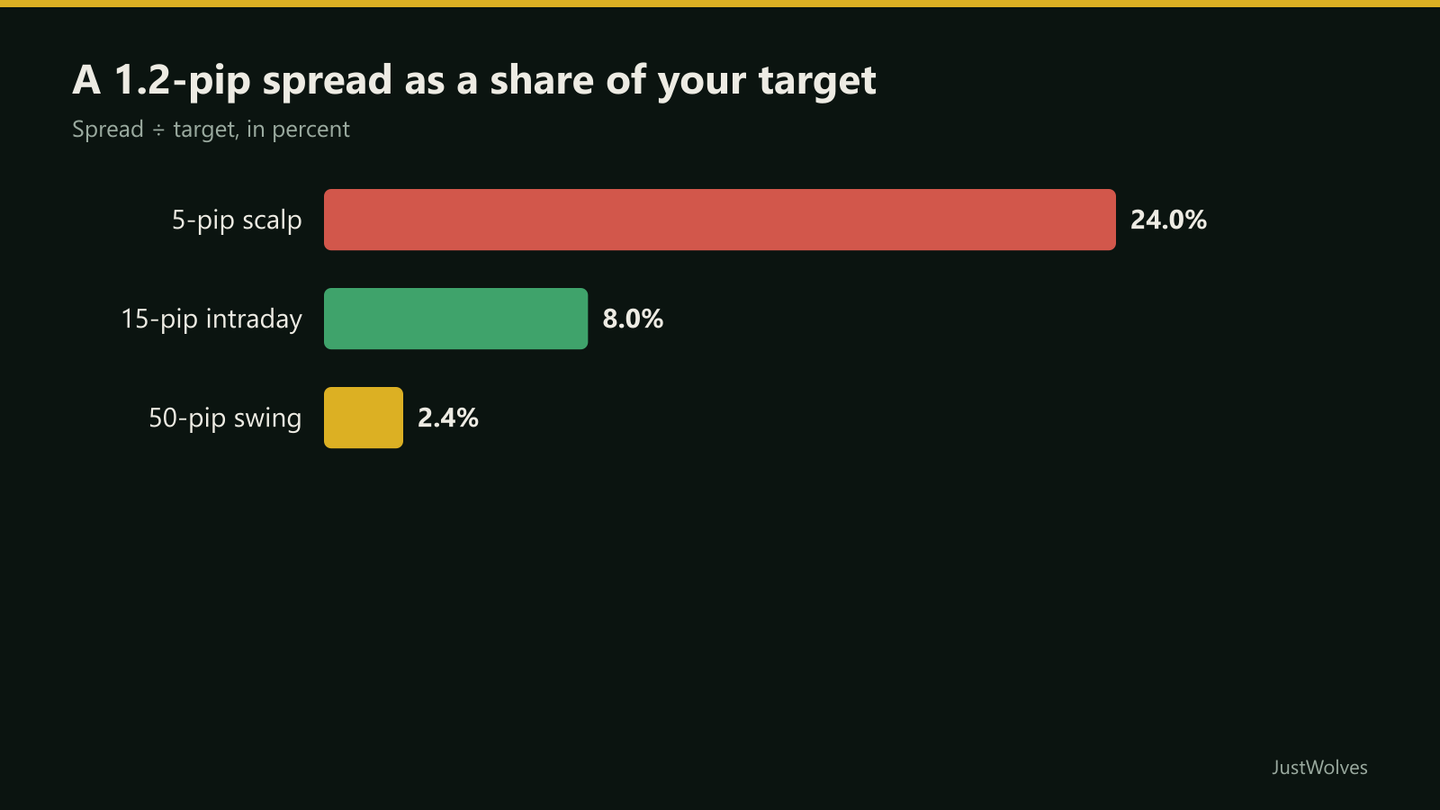
A scalper aiming for 5 pips gives up nearly a quarter of every winning trade to the spread, and loses the spread on top of every losing one. That's why scalping only works in the most liquid pairs and hours, and why the Scalping & Intraday course starts with costs.
Step by Step: Checking Your Costs Before a Trade
A quick cost check
Step 1: Read the live spread
Compare it with the pair's normal spread at this time of day.
Step 2: Convert to money
Spread × pip value for your position, plus any commission.
Step 3: Compare with your stop and target
If costs are more than about 10% of the target, reconsider.
Step 4: Avoid unusual spreads
If the spread is far wider than normal, wait or skip.
Practical Example
Kavya scalps EUR/USD for 6-pip targets with 6-pip stops, a 1:1 plan that needs a win rate above 50% to break even before costs. With a 1.2-pip spread, each win nets about 4.8 pips and each loss costs about 7.2 pips. Her break-even win rate rises to 7.2 ÷ (4.8 + 7.2) = 60%.
Moving to 20-pip targets and stops on a slower timeframe, the same spread makes wins 18.8 pips and losses 21.2 pips: a break-even win rate of 53%. The strategy didn't get better; the spread just took a smaller bite.
How Big Is the Spread Compared With the Market's Movement? Our Data
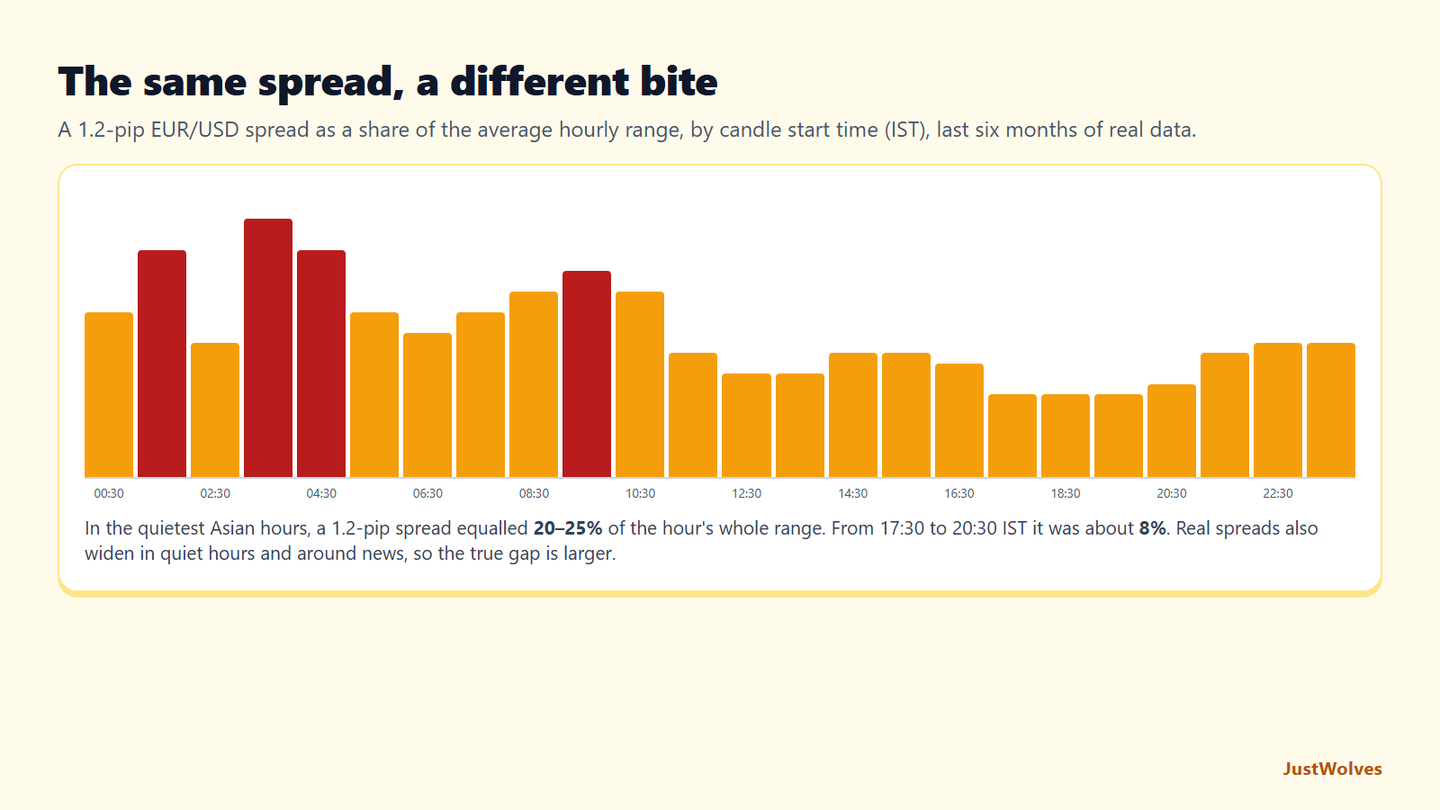
JustWolves measured the average range of every hourly EUR/USD candle over the last six months of real data (May to November 2026), grouped by start time in IST, and compared it with a fixed 1.2-pip spread, the example used throughout this lesson.
| Candle start (IST) | Average range | Spread as a share of the range |
|---|---|---|
| 03:30 (quietest) | 4.9 pips | 25% |
| 09:30 (Asian morning) | 5.9 pips | 20% |
| 12:30 (London opening) | 12.2 pips | 10% |
| 15:30 (London afternoon) | 9.6 pips | 12% |
| 17:30 (New York opening) | 15.6 pips | 8% |
| 19:30 (London–New York overlap) | 15.1 pips | 8% |
The same spread is about three times as expensive, relative to the movement available, in the quietest Asian hours as in the London–New York overlap. Combine that with this lesson's point about targets and the conclusion is clear: short targets and quiet hours are the worst combination for spread cost.
The numbers also show why the break-even maths in Kavya's example matters. Here is the win rate needed to break even after a 1.2-pip spread, for trades with equal targets and stops:
| Target and stop | Net win | Net loss | Break-even win rate |
|---|---|---|---|
| 5 pips | 3.8 pips | 6.2 pips | 62% |
| 10 pips | 8.8 pips | 11.2 pips | 56% |
| 20 pips | 18.8 pips | 21.2 pips | 53% |
| 50 pips | 48.8 pips | 51.2 pips | 51% |
A random entry with an equal target and stop wins about half the time before costs. With 5-pip targets, a trader needs 62% winners just to break even: a large edge to find. With 50-pip targets, 51% is enough. Our test of a simple session-breakout strategy in Forex Order Types shows the same effect on real data: a small edge before costs shrank by about 40% once a realistic spread was deducted.
Common Mistakes
- Forgetting you buy at the ask. Your entry is slightly above the chart's bid line.
- Placing stops exactly at the chart level. Sell stops trigger on the bid, buy stops on the ask; leave a buffer.
- Trading around news without checking the spread.
- Comparing brokers on spread alone when one also charges commission.
- Scalping exotic pairs, where spreads swallow small targets.
Professional Insight
Short-term professionals track their *effective* spread: the difference between the mid-price when they decided to trade and the price they actually got, including slippage. Over thousands of trades, a fraction of a pip saved per trade adds up to a large share of profits, which is why execution quality matters so much more for frequent traders.
Risk Considerations
- Spread spikes can trigger stops even when the mid-price never reached them.
- Costs compound with frequency: a small spread on many trades is a large cost.
- Wide spreads in thin markets signal higher slippage risk too.
Important Terminology
| Term | Meaning |
|---|---|
| Bid | The price at which you can sell. |
| Ask (offer) | The price at which you can buy. |
| Spread | Ask minus bid; a cost paid on every trade. |
| Variable spread | A spread that changes with market conditions. |
| Commission | A separate fee per trade or per lot. |
| Round trip | Opening and closing a position. |
What is the bid and ask price?
The bid is the price you can sell at; the ask is the price you can buy at. The ask is always higher.
What is a spread in forex?
The difference between the ask and bid price, usually measured in pips. It's a cost you pay on every trade.
Why do spreads widen?
Because liquidity thins, for example around major news, at the daily rollover, at the weekly open, and in less traded pairs.
Is a raw spread account cheaper?
Sometimes. Compare the spread plus commission against a spread-only account's wider spread, for the same position size.
How do I calculate spread cost?
Multiply the spread in pips by the pip value for your position size, and add any commission.
When is the forex spread cheapest relative to price movement?
For EUR/USD in our data, during the London–New York overlap (about 17:30 to 20:30 IST), when a 1.2-pip spread was about 8% of the average hourly range, against about 20–25% in the quietest Asian hours.
What win rate do I need to break even after the spread?
It depends on your target. With equal targets and stops and a 1.2-pip spread, you need about 62% winners for 5-pip trades, 56% for 10-pip trades and 51% for 50-pip trades.
Practical Exercise
Measure spreads yourself on a demo account or your broker's quote screen.
Your task
Step 1: Record the spread three times
On EUR/USD in the Asian session, the London–New York overlap, and around the daily rollover.
Step 2: Convert to money
For a 0.1-lot position at each time.
Step 3: Compare with targets
Calculate each spread as a percentage of a 10-pip and a 40-pip target.
Step 4: Decide
Which hours and target sizes suit your costs?
Check Your Understanding
EUR/USD is quoted 1.08497 / 1.08509. At what price do you buy?
Related Lessons
Previous: Lot Size in Forex. Next: Leverage and Margin in Forex. For every cost of a trade, see Forex Trading Costs. See also Win Rate, Expectancy and Profit Factor for how costs reduce expectancy.