Stop Trading Noise: A 3-Step Higher Timeframe Trading Framework

JustWolves is an educational platform and is not a SEBI-registered investment advisor. Trading financial instruments involves significant risk of loss and may not be suitable for all investors. Past performance is not indicative of future results. Read our full disclaimer →

In this article · 14 sections
Many traders spend months or years staring at the 5-minute chart before realising the problem was never the strategy — it was the perspective. Lower timeframes do not show you the market. They show you noise: algorithm spikes, retail panic, random ticks that carry zero directional information. The traders who finally become consistently profitable do not find a better indicator or a better signal service. They find a better perspective. This article covers two interconnected ideas: why higher timeframes give lower ones their context, tested on real prices, and the precise 3-step Direction → Key Level → Entry framework that gives you a repeatable way to find and execute trades in the direction of real institutional money.

Why Lower Timeframes Keep You Losing
Many retail traders operate primarily on 5-minute or 15-minute charts. The logic feels sound — more candles means more information, faster entries, more opportunities. But this reasoning breaks down in practice. Past a certain point, more data on lower timeframes does not create more insight. It creates more confusion.
Lower timeframe candles reflect emotional decisions: a retail trader panicking out of a position, an algorithm filling an order, a news spike that reverses within seconds. These moves are not directional signals. They are noise within a larger structure. When you trade that noise, you are not trading the market — you are trading other traders' emotional reactions to the market.
There is also a structural disadvantage at play. Market makers and institutional algorithms know exactly where retail stop-losses cluster on lower timeframes — above obvious highs, below obvious lows, near round numbers. They drive price into those clusters to trigger retail orders, fill their own positions, and then reverse. The 5-minute chart shows you that manipulation as it happens but gives you no context for why it happened or what follows. A daily or weekly chart gives you both.
I spent two years on the 5-minute chart. I thought more data meant better decisions. The day I switched to higher timeframes, my account grew more in six months than it had in the previous two years combined.
The River Analogy — Perspective Is Everything
Imagine standing at the edge of a river, focused on one spot directly in front of you. You see water swirling in different directions — little eddies going backward, currents moving sideways, random splashes. If you only watched that single spot, you might conclude the river has no direction at all. It looks like pure chaos.
Now step back and view the entire river from above. The direction becomes obvious. The river is flowing one way. Every eddy, every back-current, every sideways splash is just a surface disturbance within a clearly directional flow.
That is the precise difference between a 5-minute and a daily chart. The 5-minute is you staring at one spot in the river. Every candle feels significant, every reversal feels like a trend change, every spike feels like an opportunity. But it is surface noise within a larger structure that the daily chart reveals immediately.
The higher timeframe does not replace the lower timeframe. It gives the lower timeframe context. The higher timeframe tells you which direction to trade. The lower timeframe gives you a better entry price within that direction. Without the higher timeframe context, every lower timeframe entry is made blind — you might enter perfectly on a 15-minute setup while simultaneously trading against a powerful daily or weekly trend that will stop you out regardless of how clean the lower timeframe signal looked.
Lower Timeframe vs Higher Timeframe
5-Minute Chart
Shows: retail panic, algo spikes, stop hunts, random noise. Result: constant emotional reactivity, frequent false signals, low follow-through on moves.
Daily Chart
Shows: institutional positioning, structural trend, real support/resistance. Result: clear direction, high follow-through, trades that pay significantly more.
The 3-Step Trading Framework

Every profitable trading strategy — regardless of the indicators used, the instrument traded, or the market — contains three essential components. These components can be found in almost every successful approach and can be applied to any market. The three steps are Direction, Key Level, and Entry. Each step answers exactly one question. Keeping each step focused on a single question is critical — mixing multiple tasks into one step is one of the most common reasons a trading plan fails under real market conditions.
The 3-Step Trading Framework
Step 1
Direction — Where is price going? Establish bullish or bearish bias on the highest timeframe.
Step 2
Key Level — Where will price react? Find the zone where bias is expected to continue.
Step 3
Entry — When do you execute? Confirm the key level is actually holding before committing capital.
The framework is strategy-agnostic — you can apply ICT concepts, classical support and resistance, Fibonacci, moving averages, or any other methodology you already use. What the framework provides is the sequence. Direction first. Key level second. Entry confirmation third. Skipping or merging any of these steps reduces the probability of success.
First: Establish Direction and Bias
The sole purpose of this step is to answer one question: where is price going? Not where it will pause, not where it will retrace, not where it will bounce — just the overall direction. Bullish or bearish. That is the complete output of Step 1.
Direction can be established in multiple ways. Market structure is the most reliable method: higher highs and higher lows indicate a bullish trend; lower lows and lower highs indicate a bearish trend. A strong displacement candle that breaks above a significant swing high and closes above it signals bullish institutional intent. A displacement below a swing low signals bearish intent.
Other methods include the relative position of price to a moving average pair (one slow, one fast), the position of price within a defined range, or a failed sweep — price attempts to break above a high, fails, and closes back inside, signalling bearish intent. Any of these methods work. The discipline is to use one consistently and to keep the output simple: bullish or bearish.
Tools for Establishing Direction
Market structure is the primary method — identify the pattern of recent swing highs and swing lows. A series of higher highs and higher lows is a bullish structure. A series of lower lows and lower highs is a bearish structure. A breakout displacement — a strong candle that closes beyond a prior significant swing point — signals a potential trend shift worth acting on.
Sweep-based direction is equally powerful in the ICT framework: when price fails to close above a recent high and the wick rejects back inside, the direction is likely lower. When price fails to close below a recent low, direction is likely higher. This method is particularly effective at session highs and lows, previous day extremes, and weekly turning points — exactly the levels institutions use as liquidity targets.
Second: Map the Key Levels
Once direction is established, the question shifts: where will price react? A key level is the specific zone where the directional bias is expected to continue. If the bias is bearish and price is currently retracing upward, the key level is the zone where that retracement is expected to stall and the downward move to resume.
A key level is not just any support or resistance line drawn on a chart. It is a zone with genuine structural significance — a place where institutional orders are likely resting, where price imbalances exist, or where the market previously made a decisive move. The most reliable key level types for this framework are fair value gaps (FVGs), order blocks (OBs), previous day highs and lows (PDH/PDL), session highs and lows, and significant higher-timeframe swing extremes.
In most sessions, multiple potential key levels will appear on the chart. You do not trade all of them — you select the most structurally significant ones and monitor them. When price approaches a marked key level, Step 3 determines whether to act on it. The key levels where multiple structural factors align at the same price zone — a confluence — are consistently the highest-probability reaction areas.
Key Level Hierarchy
Not all levels carry equal weight. When multiple levels exist, prioritise in this order: weekly highs and lows first, then previous day high and low, then session highs and lows, then H4/H1 order blocks, then H1/15M fair value gaps. A level that combines multiple factors — an H1 order block sitting inside a daily FVG, just below the previous day high — is a multi-factor confluence and commands the most attention.
The practical rule: when price approaches two key levels in sequence, watch the highest-timeframe one first. If it holds with confirmation, take the trade. If price breaks through it, reassess whether the next level now carries the full structural weight.
Third: Wait for Entry Confirmation
Direction tells you where price is going. A key level tells you where it will react. Entry confirmation answers one final question: is this specific key level actually going to hold?
Confirmation is required because multiple valid key levels will often exist at the same time. If you place limit orders at every level, some will fail and you will have no systematic way to distinguish winners from losers in advance. Confirmation is the filter that separates the holding levels from the failing ones in real time — before you have committed capital.
There are two primary confirmation methods. A candle entry uses a specific price action pattern at the key level as the trigger: pin bars (long wick rejections), engulfing candles that close in the bias direction, or doji indecision followed by a strong directional candle. A bearish engulfing candle at a bearish key level in a downtrend is a candle entry. These are faster entries with better average entry price but slightly lower win rate.
A structure entry is more conservative and typically higher probability. After price reaches the key level, you wait for a market structure shift (MSS) on a lower timeframe — a candle that closes beyond a recent swing in the direction of your bias. A bearish MSS at a bearish key level means a lower timeframe candle has closed below a recent swing low, confirming that selling pressure has genuinely resumed. Enter short with stop above the swept high. These entries sacrifice a few pips of entry price for significantly more confidence that the level is holding.
Entry Confirmation — Step-by-Step Execution
Step 1: Price approaches the key level — observe first
Do not enter the moment price touches a key level. Watch how it arrives. Is there momentum behind the move into the level (likely to punch through), or is the move slowing with wicks forming (likely to reject)? A level touched with a slow, grinding approach is more likely to hold than one hit with a sharp, high-volume spike.
Tip: Most key levels that fail do so aggressively — price closes through with a full candle body. A wick rejection at the level with a close back inside is the first sign it is likely to hold.
Step 2: Choose your confirmation type
Candle entry: look for a pin bar, engulfing candle, or doji-to-directional sequence at the key level. Enter on the next candle open. Structure entry: wait for a market structure shift (MSS) on the lower entry timeframe at the key level — a candle closes beyond a recent swing in your bias direction. Structure entries have higher win rates; candle entries have better average prices. Start with structure entries.
Tip: For beginners: use only structure entries until you reach consistent profitability. Then add candle entries on high-confluence setups.
Step 3: Verify lower timeframe alignment
Drop to your entry timeframe (see the Timeframe Alignment section for the correct pair). Confirm the entry signal exists on that lower timeframe within the higher timeframe key level zone. The key level is identified on the intermediate timeframe. The entry trigger fires on the lower timeframe. Both must agree.
Step 4: Set stop-loss and target before entering
Stop: above the swept swing high for shorts, below the swept swing low for longs, with a small buffer for spread and volatility. Target: the next significant key level in your bias direction — the opposing session extreme, PDH/PDL, or the next higher timeframe swing point. Minimum acceptable R:R is 1:2. If the nearest logical target does not give you 1:2, skip the trade.
Tip: Calculate R:R before entering — not after. A trade that looks good on the chart but only offers 1:1 R:R is not worth taking regardless of how clean the setup is.
Timeframe Alignment Rules
Timeframe alignment is what separates a 2:1 risk-reward trade from a 5:1 or 6:1 trade on the same underlying setup. Using only one timeframe — even the daily — limits both your entry precision and your reward potential. The key is pairing a higher timeframe for direction and key levels with a lower timeframe for entry confirmation.
There are two alignment models. The two-timeframe model uses one higher timeframe for Steps 1 and 2 combined and one lower timeframe for Step 3. The three-timeframe model uses a separate timeframe for each step — highest for direction, intermediate for key levels, lowest for entry. The three-timeframe model consistently produces higher R:R because the entry price is more precise relative to the key level.
Recommended Timeframe Alignment Pairs
Weekly → H4 → 15M
Weekly: direction. H4: key levels. 15M: entry. For swing and position traders.
Daily → H1 → 15M
Daily: direction. H1: key levels. 15M: entry. For intraday swing and day traders.
H4 → 15M
H4: direction + key levels. 15M: entry. For active day traders and scalpers.
Use only these specific pairs — do not mix random timeframes. Each pair has a meaningful structural relationship where the higher timeframe genuinely governs the lower. A daily direction with a 1-minute entry chart creates too large a gap; the entry becomes disconnected from the higher timeframe structure. A H1 direction with a H1 entry combines two steps onto one timeframe and loses precision.
Trade frequency decreases as you move to higher timeframe pairs. The Weekly → H4 → 15M alignment produces 1–3 setups per week across a basket of instruments. The H4 → 15M alignment produces 3–7 per week. Lower frequency does not mean lower profitability — the significantly higher average R:R per trade more than compensates.
When to Walk Away From the Setup
The framework only works when all three steps confirm in sequence. If price reaches your mapped key level but no entry confirmation forms on the lower timeframe — no rejection candle, no shift in structure — the setup is invalid. Waiting longer at the same level does not manufacture confirmation.
It is also invalid if the higher-timeframe direction changes before entry: a clean break and close through the higher-timeframe bias level means the original directional read was wrong, and the trade should be abandoned rather than reworked to fit the new price action.
Forcing an entry on a lower timeframe against an unconfirmed or broken higher-timeframe bias is the most common way this framework gets misused.
Trade Walkthroughs: Two Illustrations and a Real Case

Example 1 (Illustrative): Bearish Setup — Daily → H1 → 15M
Step 1 (Direction, Daily): The daily chart shows a sequence of lower lows and lower highs over the past two weeks, with a strong displacement candle closing below a prior swing low. Daily bias: bearish.
Step 2 (Key Level, H1): Price is in a short-term retracement upward. On the H1 chart, an order block formed at the origin of the most recent bearish displacement. A fair value gap sits just above the OB. The previous day high is 15 pips above the FVG top. The confluence zone — where OB, FVG, and PDH align — becomes the key level.
Step 3 (Entry, 15M): Price enters the H1 confluence zone. On the 15M chart, a market structure shift occurs — a 15M candle closes below a recent 15M swing low, confirming bearish momentum has resumed. Enter short at the close of the MSS candle. Stop: above the PDH plus 5-pip buffer. Target: previous day low. Result: 4.2:1 R:R.
Example 2 (Illustrative): Bullish Setup — Weekly → H4 Entry
Step 1 (Direction, Weekly): Weekly chart shows a series of higher highs and higher lows over the prior month. Price has pulled back to a major weekly support zone after a bullish expansion. Weekly bias: bullish.
Step 2 (Key Level, H4): Within the weekly support zone, the H4 chart reveals a bullish order block — the last bearish H4 candle before the most recent strong bullish move higher. Price is now retesting this OB.
Step 3 (Entry, H4): A pin bar forms at the H4 OB with a long lower wick rejecting the zone. Candle entry: enter long at the close of the pin bar. Stop: below the OB low with a small buffer. Target: the most recent weekly high. R:R: 5.1:1. The weekly direction created the context; the H4 OB provided the level; the pin bar provided the timing.
Notice that in both examples, the entry was never considered until Steps 1 and 2 were complete. Direction first. Key level second. Entry only when the level provides confirmation. The sequence is the strategy.
Real Prices: Daily → H1 on the NIFTY 50
The two examples above are illustrations. The chart below applies the same three steps to real NIFTY 50 prices from late October and early November 2026: direction from the daily structure, a key level on the hourly chart, and an hourly confirmation candle for the entry.
Real prices: direction, key level and entry on the NIFTY 50, 29 October – 6 November 2026
Step 1 of 4
Step 1: direction
On the daily chart, the NIFTY 50 has made higher lows since its 8 October low of 22,180: 22,288, 22,372 and 22,387. On the hourly chart it climbs through 29–30 October to a high of 23,118.
- What to observe
- Daily structure is turning up.
- Condition
- A daily higher high above 23,175 (19 October) would confirm it.
The Psychology Advantage of Higher Timeframes
Lower timeframes create a specific form of psychological pressure. You are watching every tick, every candle, every small adverse move. Each reversal against you feels like a disaster. Each gain tempts you to close early. You are in a constant state of emotional reactivity — and that reactivity is one of the primary causes of undisciplined execution.
Higher timeframe trading removes most of that pressure. You identify the setup on the daily or weekly chart. You mark your key levels. You set your entry condition. Then you wait. You check once or twice a day. The trade either triggers or it does not. When it does trigger and moves in your direction, you are not watching every tick — you already know the higher timeframe structure supports the move, so there is no reason to exit early.
This is not a minor benefit. Stress causes traders to cut winners early, widen or move stop-losses, over-trade after a loss, and abandon valid setups. Higher timeframes reduce the stimulus that triggers all of those behaviours. Fewer trade decisions per day means fewer opportunities for discipline to break down. Moving from 8 hours of screen time on 5-minute charts to 1–2 hours on daily charts does not have to reduce results; for many traders, fewer and better-placed trades improve them.
There is also a practical benefit from the increased time available. Traders who move to higher timeframes consistently report spending less time at screens, feeling less stressed, and making better decisions — not because the market got easier, but because they gave themselves the conditions needed to think clearly. A trade taken on the daily chart gives you hours to set your stop and target correctly. A trade taken on the 5-minute chart gives you seconds.
Does the Higher Timeframe Help? Our Test on Real Trades
This framework's first rule is to trade only in the direction of the higher timeframe. JustWolves tested that rule on two intraday strategies from our scalping posts, applied mechanically to real 5-minute prices for the NIFTY 50 and 10 large NSE stocks from August to November 2026: the EMA 7/17 slope and trigger-candle setup (1R stop, 3R target) and the EMA 9/15 crossover (stop beyond the previous candle, 2R target). For each trade we checked the daily trend: whether the previous day's close was above or below its 50-day EMA. Costs: 2 index points per round trip on the NIFTY 50 and 0.06% of price on stocks.
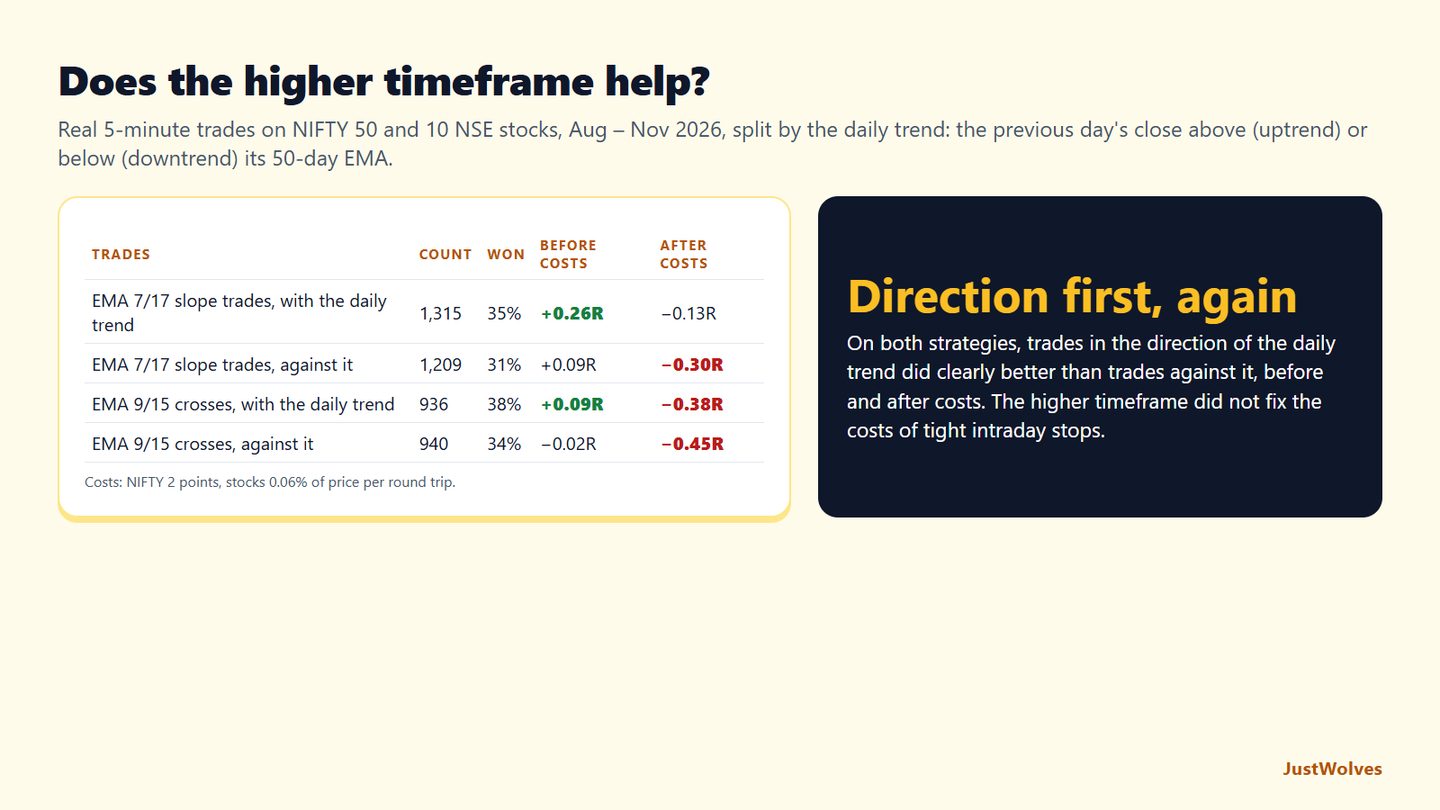
| Trades | Count | Won | Before costs | After costs |
|---|---|---|---|---|
| EMA 7/17 slope trades, with the daily trend | 1,315 | 35% | +0.26R | −0.13R |
| EMA 7/17 slope trades, against it | 1,209 | 31% | +0.09R | −0.30R |
| EMA 9/15 crosses, with the daily trend | 936 | 38% | +0.09R | −0.38R |
| EMA 9/15 crosses, against it | 940 | 34% | −0.02R | −0.45R |
Direction first was right. On both strategies, trades in the direction of the daily trend did clearly better than trades against it: +0.26R against +0.09R per trade for the EMA 7/17 setup, and +0.09R against −0.02R for the EMA 9/15 cross, before costs. The win rate was higher by 4 percentage points in both cases. That is the central claim of this framework, and on real NSE data it held.
The higher timeframe did not fix everything. After costs, all four groups were negative. These intraday strategies use stops of one or two 5-minute candles, and costs of 0.06% on a stock can be a third of that risk. Aligning with the daily trend improved the trades; it did not make tight intraday stops affordable. That is the second argument of this article: moving the entry itself to a higher timeframe, with wider stops and fewer trades, reduces the share of each trade that goes to costs.
One filter, one sample. Our daily-trend test is simple: one moving average on one day's close. The full framework adds key levels and confirmation, which are harder to test mechanically. Record your own trades by whether they were with or against the higher timeframe, and you will build the most relevant evidence of all.
Common Mistakes to Eliminate
Mistakes That Undermine Higher Timeframe Trading
- Finding a valid setup on the daily chart, then dropping to the 15-minute to "refine the entry" — the 15-minute will show 10 reasons not to take the trade and you will talk yourself out of a valid setup
- Skipping Step 1 entirely and jumping to key levels — trading a key level without direction alignment means you are equally likely to be with or against the dominant institutional flow
- Placing limit orders at every key level simultaneously without waiting for Step 3 confirmation — this signals that none of the levels have been truly qualified
- Using mismatched timeframe pairs (e.g. weekly direction with a 1-minute entry) — the gap is too large and the entry becomes structurally disconnected from the higher timeframe bias
- Treating direction as permanent — a bias established on Monday can be invalidated by Wednesday; re-assess Step 1 at the start of each session and after any significant displacement
- Confusing lower timeframe noise for structure — a 5-minute sequence that looks like a breakout is meaningless if the daily and hourly structure is fully intact in the opposite direction
- Taking trades outside high-participation windows — on intraday setups, higher timeframe structure is most reliably delivered during London open and New York open; avoid mid-session drift
- Mixing the steps — adjusting your directional bias because a key level is nearby, or choosing a key level based on where the entry looks cleanest — each step must be answered independently
Framework Recap
Higher Timeframe Strategy — The Complete Summary
- Lower timeframes reflect noise and retail emotional reactions; higher timeframes reflect structural institutional movement — trade structure, not noise
- Institutions cannot practically trade on 5-minute charts, so their positioning footprints only appear on higher timeframes; that is where the predictable, profitable moves originate
- The 3-step framework: Direction (where is price going?) → Key Level (where will it react?) → Entry (when do you execute?) — answer each step separately and in sequence
- Step 1 output is binary: bullish or bearish — no conditions, no mixed signals, just directional bias from the highest timeframe in your setup
- Step 2 identifies where the bias continues — the key level is where the retracement ends and bias-direction momentum resumes; mark confluence zones first
- Step 3 confirms the key level is holding before capital is committed — use candle entries (pin bar, engulfing) or structure entries (15M MSS) as the confirmation mechanism
- Recommended timeframe alignment pairs: Weekly→H4→15M for swing, Daily→H1→15M for intraday swing, H4→15M for day trading — do not use random combinations
- The three-timeframe model can improve R:R from 2:1 to 5:1 or better on the same setup compared to single-timeframe analysis
- Start with structure entries (market structure shift confirmation) before adding candle entries — structure entries have higher win rates for developing traders
- Higher timeframes enforce patience and reduce screen time — the psychological and practical benefits are as valuable as the structural edge they provide
Frequently Asked Questions
What is the minimum timeframe I should use for direction?
For most retail traders, the daily chart is the lowest acceptable timeframe for Step 1 (Direction). If you are a day trader using the H4 → 15M alignment, then H4 is your direction timeframe. The general rule is that your direction timeframe should be at least 4× higher than your entry timeframe — daily to 15-minute works; hourly to 15-minute does not give enough structural context.
Can this 3-step framework be combined with ICT concepts?
Yes — the framework is strategy-agnostic and integrates naturally with ICT. Step 1 uses market structure analysis and displacement candles for direction. Step 2 uses order blocks, fair value gaps, and PDH/PDL as key levels. Step 3 uses market structure shifts (MSS) and change in state of delivery (CISD) as entry confirmation. Our Gold ICT Key Level Strategy guide uses this exact three-step sequence with ICT concepts on XAUUSD.
How many trades per week is normal with higher timeframe trading?
Significantly fewer than lower timeframe approaches — and that is by design. With a Daily → H1 → 15M setup across a basket of 5–10 instruments, expect 3–7 qualified setups per week. With a Weekly → H4 setup, expect 1–3. This lower frequency feels wrong at first because it conflicts with the desire to be active. But lower trade frequency combined with 4:1 to 6:1 R:R per trade produces better results than high-frequency trading at 1:1 to 2:1 R:R.
How do I handle conflicting direction signals between timeframes?
When the weekly shows bullish and the daily shows bearish, wait. Do not enter in either direction. The conflict tells you the market is in a transitional phase — the daily is potentially correcting within a weekly uptrend. Wait for the higher timeframe (weekly) to resolve the conflict: either the daily realigns bullish, or the weekly structure breaks down. Entering against the higher timeframe direction is trading against the dominant flow, and the probability of a successful outcome is materially lower.
What is the difference between a candle entry and a structure entry at a key level?
A candle entry uses a specific price action pattern at the key level as the trigger: a pin bar, an engulfing candle, or a doji-to-directional sequence. You enter on the next candle open after the signal candle closes. A structure entry waits for a market structure shift (MSS) on the lower timeframe at the key level — a candle close beyond a recent swing in your bias direction. Candle entries give a better average entry price but a slightly lower win rate. Structure entries are more filtered and have higher win rates but a slightly later entry. Start with structure entries until you have 30+ consistent trades, then evaluate whether candle entries add value.
Should I ever look at the 5-minute chart at all?
There is no rule against it, but you should never let it influence your directional bias or key level selection. The 5-minute chart is only relevant as an entry execution tool — and even then, a 15-minute chart usually provides sufficient precision for most strategies. If you find yourself dropping to the 5-minute and then talking yourself out of a valid higher-timeframe setup because of what you see, stop using the 5-minute entirely until you have a solid track record on higher timeframes.
Does trading with the higher timeframe trend improve results?
In our test on real NSE 5-minute trades from August to November 2026, yes. EMA 7/17 trades in the direction of the daily trend averaged +0.26R per trade before costs, against +0.09R for trades against it, and EMA 9/15 crosses showed the same pattern.
Topics