Scalping
9 & 15 EMA + Stochastic Momentum Index
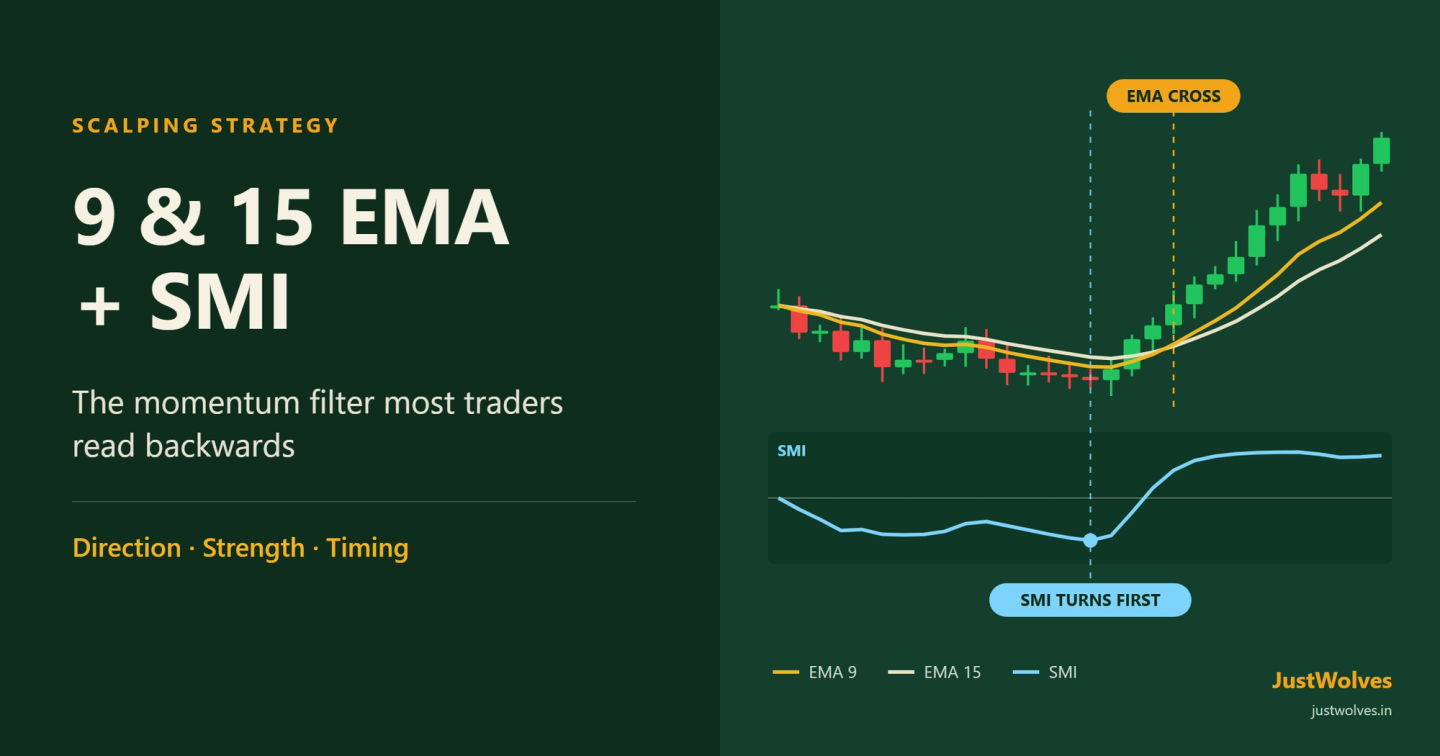
The EMA crossover tells you direction changed. It says nothing about strength. The Stochastic Momentum Index fills that gap — if you read it the right way round.

JustWolves is an educational platform and is not a SEBI-registered investment advisor. Trading financial instruments involves significant risk of loss and may not be suitable for all investors. Past performance is not indicative of future results. Read our full disclaimer →
In this article · 9 sections
Key Takeaways
- EMA 9 and EMA 15 set the direction and the entry trigger — the Stochastic Momentum Index (SMI) is only ever a filter, never the entry itself.
- Separation matters more than the cross: two EMAs that keep tangling with no gap between them means a range, not a trend.
- Most traders read the SMI backwards — a shallow pullback in a strong trend is a sign of strength, not weakness, even if it never reaches oversold.
- The best crossovers happen while the SMI is still climbing and hasn't hit the extreme yet, typically between 0 and +40 for longs (the mirror range for shorts). In our real-price test, this group did best before costs.
- An SMI cross deep in oversold or overbought is not a buy or sell signal by itself — it only becomes one once the EMAs agree.
Take an EMA 9 / EMA 15 crossover on its own and you'll take a lot of trades that look perfect and go nowhere. The candle closes clean above both lines, price ticks up a few points, and then it reverses straight back through them. The crossover isn't wrong, exactly — it's just incomplete. It tells you direction flipped; it says nothing about whether there's any strength behind that flip. That's the gap the Stochastic Momentum Index is built to close.
Setting up the chart
Add the Exponential Moving Average twice — length 9 and length 15 — in two distinct colors on your price chart. Then add the Stochastic Momentum Index in its own panel underneath, and change its inputs: K-length 7, D-length 2, EMA-length 2, instead of the slower defaults most platforms ship with.
That's the full setup: two lines on price, one oscillator panel below. The blue SMI line reacts to every candle close; the orange signal line is simply a smoothed average of it. Plus-40 marks overbought, minus-40 marks oversold, and zero is the midline.
What EMA separation is really telling you
EMA 9 above EMA 15, both sloping up, with clear space between them — that's a bullish read, long setups only. Mirror it for bearish. When the two lines go flat and keep crossing back and forth with no separation, that's a range, and the correct move is no trade at all, regardless of what the oscillator underneath is doing.
The EMAs decide direction. The SMI never overrides that decision — it only ever tells you whether a signal in that direction is worth acting on.
The reading almost everyone gets backwards
The instinct is to buy when the SMI drops below minus-40 and sell when it spikes above plus-40. In a tight, ranging market that reading will trigger on almost every candle, because it doesn't take much movement to close near the top or bottom of a small range — and not one of those swings is worth trading.
In a genuine trend, the opposite pattern shows up. Price barely gives anything back on a pullback, so the SMI might only dip to minus-20 during an uptrend and never come close to oversold at all. Waiting for a deep oversold reading inside a strong trend means waiting for a signal that may never arrive — that shallow dip is the pullback, and it's actually the stronger tell, not a weaker one.
The rule that ties it together
| SMI reading at the cross | What it means | Action |
|---|---|---|
| Still climbing, below the overbought line (roughly 0 to +40 for longs) | The move has room left before it's exhausted | Take it — this is the sweet spot |
| Lower than that and climbing hard (e.g. below 0 curving up for a long) | Even more room to run before hitting overbought | Be careful: in our real-price test, this group did worst of all |
| Already above +40 and flattening out | The move is already largely spent | Skip it, no matter how clean the crossover looks |
Real Prices: The Sweet Spot on NIFTY 50
The chart below walks through one real cross on the NIFTY 50 5-minute chart from 9 October 2026: a downswing that stalls, two EMAs that flatten together, a cross with the SMI at +36 and rising, and a 2R target reached an hour later.
Real prices: an EMA 9/15 cross with the SMI in the sweet spot, NIFTY 50, 9 October 2026
Step 1 of 4
A downswing that stalls
On 9 October 2026 the NIFTY 50 drifts lower from 22,509 to 22,446 by 11:55 am. EMA 9 sits under EMA 15: shorts only, or no trade.
- What to observe
- Direction is bearish but the drop is losing pace.
- Condition
- No long until EMA 9 crosses above EMA 15.
Why not just trade the SMI cross directly?
It's a fair question, since the SMI moves before the EMAs do. The answer is that the SMI crosses up and down constantly — in trends, in chop, in everything — because it's a fast oscillator reacting to every candle close. Traded on its own, it produces far more noise than signal.
The EMA crossover is what confirms direction has actually turned, not just flickered. The SMI's only job is to tell you whether that confirmed turn still has strength behind it, or whether the move is already running out of road by the time the slower EMAs finally catch up.
Two worked examples
A long, gold on the 5-minute: price has been in a downtrend and starts to base. EMA 9 crosses above EMA 15. At that exact candle, the SMI is still below +40 and climbing hard — though in our real-price test below, crosses with the SMI still under zero did worse than those between 0 and +40. Entry comes as the candle closes above both EMAs, with the stop placed just below the low of the candle before it.
A short, on a different market and a higher timeframe: price tops out and rolls over, EMA 9 crosses below EMA 15, and the SMI is just below the zero line and curving down — nowhere near oversold, meaning plenty of room to fall. Entry, stop and target logic mirror the long: enter as the candle closes below both EMAs, stop just above the high of the prior candle. For targets, many traders use a fixed multiple of risk, such as 1.5 to 2 times the stop distance, or exit when the EMA 9 closes back across the EMA 15. On 1 to 5-minute charts, brokerage, taxes and spread are a large share of each move, so check that the target is several times your round-trip cost before taking the trade.
Does the SMI Filter Work? Our Test on Real Prices
JustWolves applied this article's rules mechanically to every EMA 9/15 cross on five sets of real prices from August to November 2026: gold futures and Bitcoin on 15-minute charts, and the NASDAQ 100, NIFTY 50 and 10 large NSE stocks on 5-minute charts. Entry: at the close of the candle where EMA 9 crosses EMA 15. Stop: beyond the previous candle's low (for longs) or high (for shorts), as in the worked examples. Target: 2R, with intraday positions closed by the end of the session. The SMI: calculated with the 7, 2, 2 settings, and each cross grouped by where the SMI stood at that moment. Costs: 2 points per round trip on the NIFTY 50, 1 point on the NASDAQ 100, $0.40 on gold, 0.1% on Bitcoin and 0.06% of price on NSE stocks.
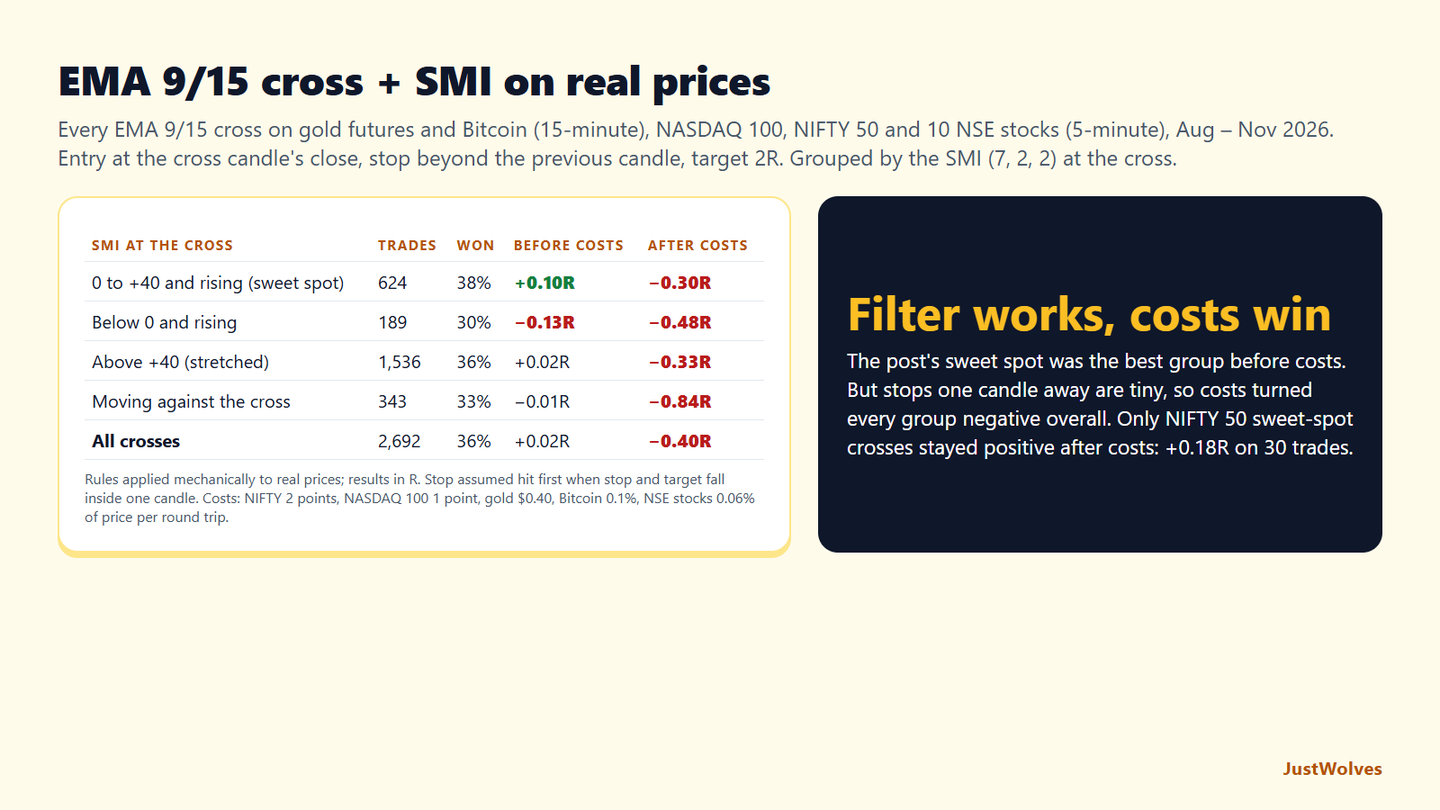
| SMI at the cross | Trades | Won | Before costs | After costs |
|---|---|---|---|---|
| 0 to +40 and rising (sweet spot) | 624 | 38% | +0.10R | −0.30R |
| Below 0 and rising | 189 | 30% | −0.13R | −0.48R |
| Above +40 (stretched) | 1,536 | 36% | +0.02R | −0.33R |
| Moving against the cross | 343 | 33% | −0.01R | −0.84R |
| All crosses | 2,692 | 36% | +0.02R | −0.40R |
The sweet spot was real, but small. Crosses with the SMI between 0 and +40 and rising averaged +0.10R before costs, against +0.02R for all crosses. That supports this article's core idea: the SMI is a filter on the cross, not a signal of its own.
The "stronger version" was the weakest. Crosses where the SMI was still below zero and curving up did worst, at −0.13R. A reading below zero at a bullish cross often meant the move had barely started and was still fragile. Our data does not support treating it as a better entry.
EMA separation made no measurable difference. Crosses where the two EMAs had tangled at least twice in the previous 20 candles averaged +0.02R before costs; clean crosses averaged +0.03R. The separation rule may still keep you calmer, but it did not change the numbers.
Results varied by market. Before costs, all crosses averaged +0.16R on the NIFTY 50, +0.17R on Bitcoin, +0.09R on the NASDAQ 100, +0.01R on the 10 NSE stocks and −0.21R on gold futures. Only the NIFTY 50 sweet-spot crosses stayed clearly positive after costs: +0.18R on 30 trades, too few to rely on.
Why Costs Decide a One-Candle Stop
The stop in this strategy sits one candle away, which is what makes the reward-to-risk attractive. It is also what makes costs so heavy. Two examples from the real data:
NIFTY 50, 9 October 2026. The stop was 21.1 index points. Round-trip costs of about 2 points are 0.1R: a 2R winner becomes 1.9R, and a 1R loser becomes 1.1R. The strategy survives that.
A ₹1,200 stock. A typical one-candle stop on a 5-minute chart is about 0.15% of price, or ₹1.80. Brokerage, exchange charges, taxes and spread for an intraday round trip come to roughly 0.06% of price, or ₹0.72. That is 0.4R on every trade. A setup that averages +0.1R before costs loses about 0.3R after them.
That is why our test showed a positive edge before costs and a negative one after, mostly on single stocks. The lesson is not that the indicator combination fails. It is that a one-candle stop is only practical where costs are a small share of that candle: liquid index instruments with low charges. Before trading the method, work out your own cost per round trip as a share of your typical stop.
Frequently Asked Questions
Do I enter when the SMI reaches oversold or overbought?
No. The SMI reading only has meaning in the context of what the EMAs are doing at that moment. A deep oversold or overbought reading on its own is not an entry signal — it's only useful once the EMA 9/15 cross confirms direction.
What SMI settings does this strategy use?
K-length 7, D-length 2, EMA-length 2 — faster than the platform default of 10/3/3, so the oscillator reacts closer to real time.
What markets and timeframes does this work on?
Traders apply it to liquid markets such as gold, Bitcoin and index futures on 1, 5 and 15-minute charts, but oscillator behaviour varies by market and no result is guaranteed. Test it on your own instrument and timeframe, with costs included, before risking real capital.
Why does the SMI only reach a shallow pullback in a strong trend?
Because in a genuine trend, price gives back very little on pullbacks, so it never closes near the bottom (or top) of its recent range. That shallow reading is a sign of trend strength, not a reason to wait for a deeper move that may not come.
Does the SMI filter improve EMA 9/15 crossover trades?
Slightly, in our test. On 2,692 real crosses across gold, Bitcoin, the NASDAQ 100, NIFTY 50 and NSE stocks from August to November 2026, crosses with the SMI between 0 and +40 and rising averaged +0.10R per trade before costs, against +0.02R for all crosses.
Is the 9/15 EMA and SMI strategy profitable after costs?
Not in our test overall. Stops one candle away are small, so trading costs took 0.1R to 0.4R from every trade and turned the results negative. Only NIFTY 50 sweet-spot crosses stayed positive after costs, on just 30 trades.
Related Scalping Strategies