Scalping
EMA 7/17 Scalping Strategy
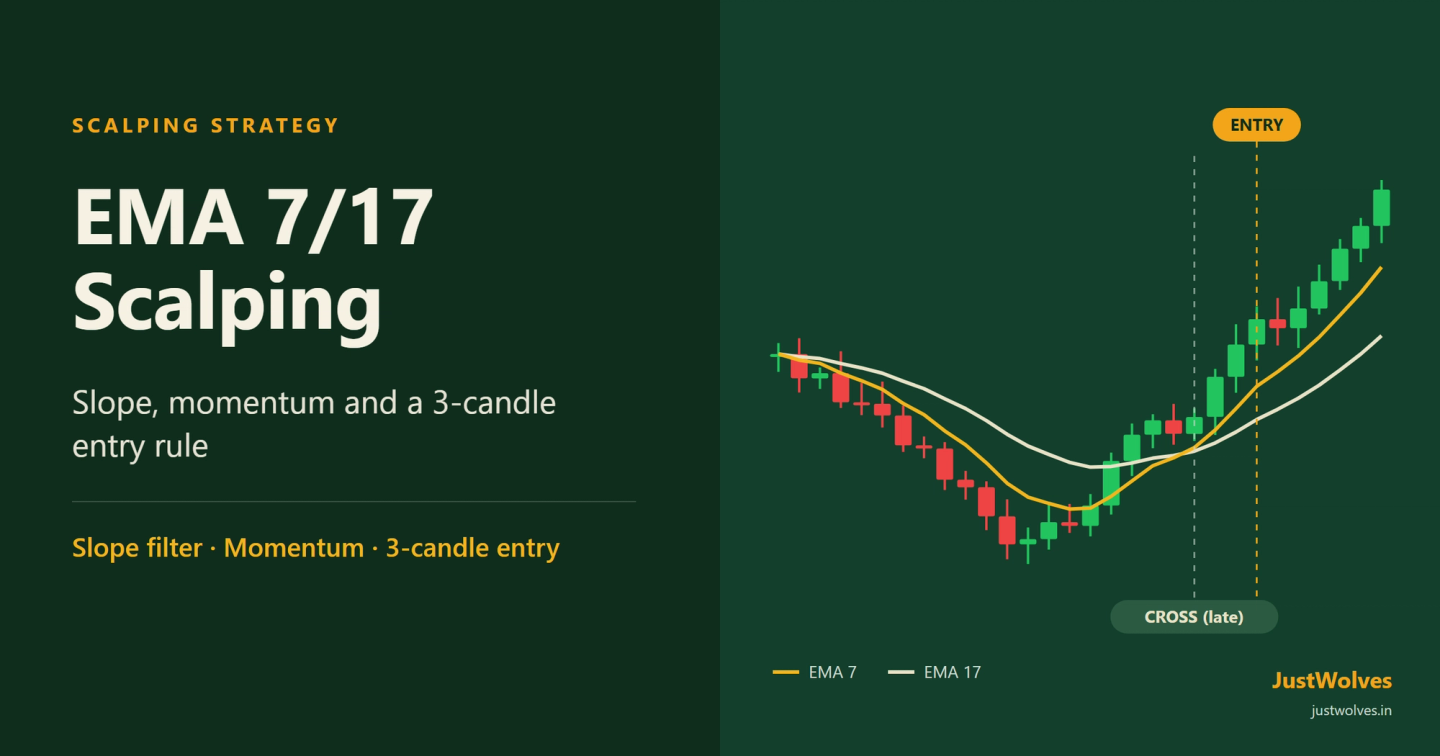
Two EMAs, one slope filter and three candle patterns — the full entry, stop-loss and target rules for scalping momentum on any five-minute chart.

JustWolves is an educational platform and is not a SEBI-registered investment advisor. Trading financial instruments involves significant risk of loss and may not be suitable for all investors. Past performance is not indicative of future results. Read our full disclaimer →
In this article · 8 sections
Key Takeaways
- Plot EMA 7 and EMA 17 on the same chart in different colors — that's the entire setup, no crossover trade needed.
- EMA 7 above EMA 17 means bullish pressure; below means bearish pressure. Direction alone isn't enough to trade.
- The slope of both lines matters more than the cross: aim for a clear, sustained angle, such as EMA 7 rising for at least the last three candles with the gap to EMA 17 widening, before considering an entry.
- Only three candle types qualify as an entry trigger: a pin bar, a strong-bodied trend candle, or an engulfing candle.
- Risk small, target big — a tight stop just beyond the trigger candle with a 1:3 target means you break even at a win rate of about 25% before costs, so the method does not depend on a high win rate. In our test on real NSE prices, 34% of trades reached 3R with the slope filter.
Scalping lives or dies on two decisions: where you get in, and where you get out if you're wrong. Everything else — which indicator you watch, which timeframe you sit on — is just a way of making those two decisions sharper. This setup uses two EMAs to read momentum and three specific candle shapes to time the entry, instead of trading the crossover itself.
Building the chart
Add the Exponential Moving Average twice: once set to a length of 7, once set to 17. Give them different colors so you can tell them apart at a glance — no squinting required mid-trade. That's the whole indicator setup.
EMA 7 tracks the last seven candles, so it reacts fast and hugs price closely. Think of it as an early-warning line. EMA 17 covers a longer stretch, moves slower, and represents the short-term trend direction underneath the noise. Together they give you a fast line and an anchor line.
Direction and slope — your only two filters before an entry
EMA 7 above EMA 17 means buyers currently have control; EMA 7 below EMA 17 means sellers do. That part is simple and it's also not enough on its own — plenty of dead, sideways markets will still show one EMA sitting above the other while price goes nowhere useful.
The filter that actually matters is the angle of the lines. A steep slope means real, aggressive participation behind the move. A flat or barely-tilted line means the market is drifting, and drifting markets are where scalp accounts bleed out one small stop-loss at a time.
The three candles worth trading
Once direction and slope both agree, you need one more thing before entering: a candle that shows real conviction. There are exactly three shapes worth acting on.
| Pattern | What it looks like | What it tells you |
|---|---|---|
| Pin bar | Small body, long wick rejecting a level | Price tried to go further and got pushed back — a rejection in the direction of the trend |
| Strong trend candle | Large body, little wick, closes near its high or low | Aggressive one-sided participation with no hesitation |
| Engulfing candle | Fully swallows the range of the candle before it | The opposing side has been overwhelmed and control has flipped |
Entry, stop-loss and target — the mechanics
How to execute the trade once a signal appears
Step 1: Confirm direction and slope
EMA 7 above EMA 17 for a buy (below for a sell), both lines sloped at a clearly visible angle — not flat.
Step 2: Wait for one of the three candles
A pin bar, strong trend candle, or engulfing candle forming in the direction of the EMA alignment.
Step 3: Enter at the break of that candle's high (buy) or low (sell)
Don't anticipate the break — wait for price to actually clear it.
Step 4: Place the stop just beyond the same candle
Below its low for a buy, above its high for a sell. This is intentionally tight.
Step 5: Target a 1:3 reward-to-risk minimum
A small, controlled stop paired with a 3x target puts the break-even win rate at about 25% before costs. Charges and slippage raise that, so count them in your results.
Real Prices: The Full Checklist on NIFTY 50
The chart below follows every step on a real NIFTY 50 5-minute session from 13 November 2026: direction turns, the slope confirms, a strong trend candle forms, the next candle breaks its low, and the 1:3 target is reached an hour later.
Real prices: slope, a trend candle and a 3R short on the NIFTY 50, 13 November 2026
Step 1 of 4
Direction turns
On 13 November 2026 the NIFTY 50 rises to 25,245 at 10:45 am, then falls for three candles. By 11:00 EMA 7 has crossed below EMA 17: sellers have control.
- What to observe
- Direction alone is not a trade.
- Condition
- Wait for slope and a trigger candle.
Confirm on a second timeframe before you pull the trigger
Run this on the 5-minute chart for entries, but keep a 1-hour chart open next to it for context. A clean 5-minute sell signal sitting right on top of 1-hour support is a lower-quality trade than the setup suggests — that higher-timeframe level can stall or reverse the move entirely.
The rule is simple: for a sell, the 1-hour chart should not be resting on major support — ideally it's near resistance or already trending down. For a buy, flip it. When both timeframes agree, the setup is a genuinely higher-probability trade, not just a clean-looking chart pattern.
Does the Slope Filter Work? Our Test on Real Prices
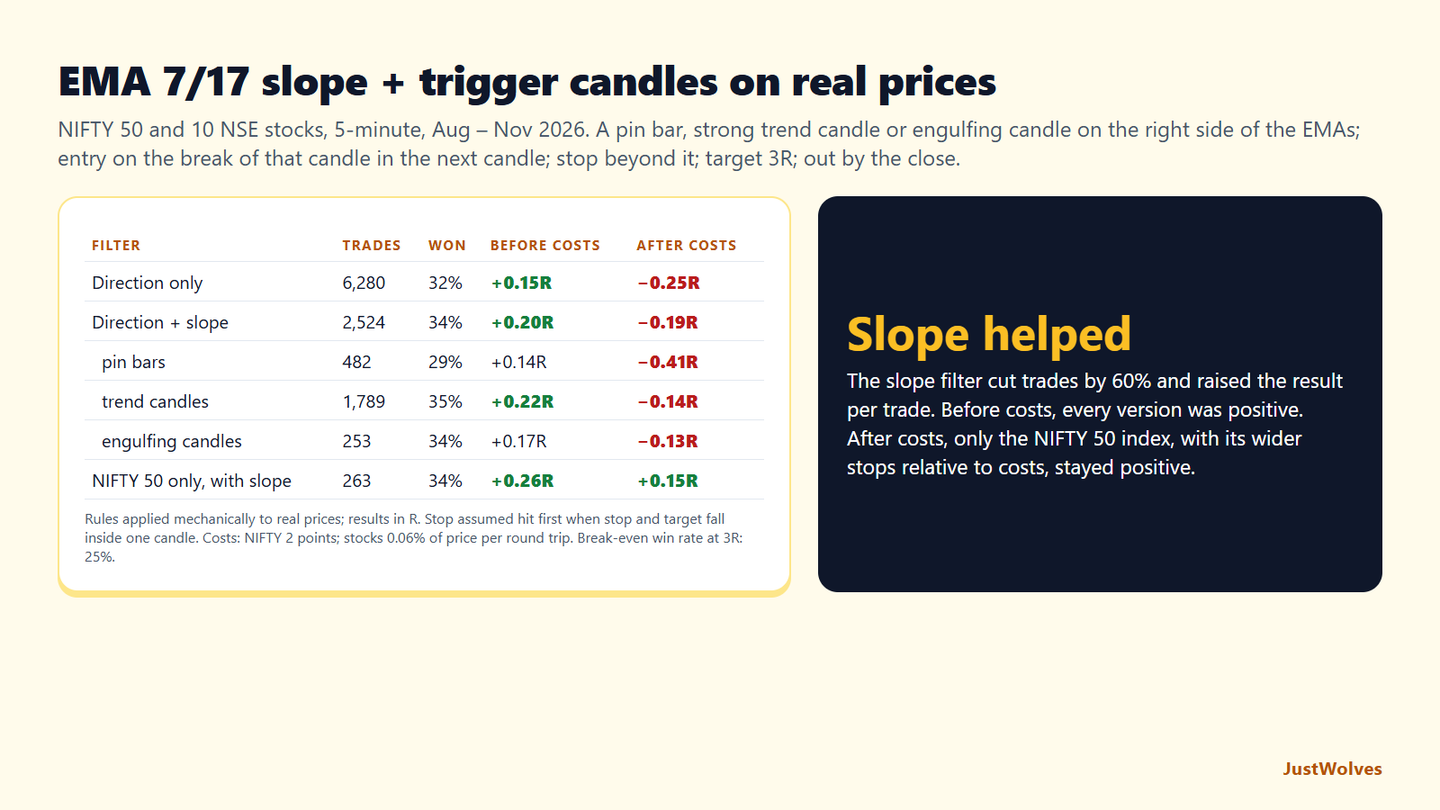
JustWolves applied this article's rules mechanically to the NIFTY 50 index and 10 large NSE stocks (Reliance, ICICI Bank, Infosys, SBI, TCS, Axis Bank, L&T, Bharti Airtel, ITC and Titan) on 5-minute charts from August to November 2026. Direction: EMA 7 above EMA 17 for longs, below for shorts. Slope: EMA 7 rising (or falling) for the last three candles, with the gap to EMA 17 widening for two. Trigger: a pin bar (rejection wick at least twice the body), a strong trend candle (body at least 70% of the range) or an engulfing candle (range swallowing the previous candle's). Entry: on the break of the trigger candle in the next candle only. Stop: beyond the trigger candle. Target: 3R, with any open trade closed at the end of the session. Costs: 2 points per round trip on the NIFTY 50 and 0.06% of price on stocks. We did not test the 1-hour confirmation, which depends on judging support and resistance.
| Filter | Trades | Won | Before costs | After costs |
|---|---|---|---|---|
| Direction only + trigger candle | 6,280 | 32% | +0.15R | −0.25R |
| Direction + slope + trigger candle | 2,524 | 34% | +0.20R | −0.19R |
| …pin bars | 482 | 29% | +0.14R | −0.41R |
| …strong trend candles | 1,789 | 35% | +0.22R | −0.14R |
| …engulfing candles | 253 | 34% | +0.17R | −0.13R |
| NIFTY 50 only, with slope | 263 | 34% | +0.26R | +0.15R |
| 10 NSE stocks only, with slope | 2,261 | 33% | +0.19R | −0.23R |
The slope filter did its job. Adding the slope rule cut the number of trades by 60%, from 6,280 to 2,524, and raised the average result from +0.15R to +0.20R before costs. That is this article's central claim, and the data supports it: flat EMAs produced weaker trades.
Trend candles beat pin bars. Strong-bodied trend candles were the most common trigger and the best, at +0.22R before costs. Pin bars won least often, 29%. On a 5-minute chart, a long wick usually means a wide candle and therefore a wide stop, while the rejection it shows is often just noise.
Before costs, everything worked; after costs, little did. A 1:3 target needs only a 25% win rate to break even, and every version cleared that comfortably. But the stop sits just beyond one 5-minute candle. On a large NSE stock that is often 0.15–0.25% of price, so intraday costs of about 0.06% take 0.25–0.4R from every trade. Only the NIFTY 50 index, where 2 points of cost is a small share of a typical 25-point stop, stayed positive after costs: +0.15R per trade on 263 trades.
What Costs Do to a 1:3 Scalp
The 1:3 reward-to-risk ratio in this method looks generous, and before costs it is. Here is what a round trip of costs does to it.
NIFTY 50, 13 November 2026. The stop was 26.6 points; costs of about 2 points are 0.08R. A 3R winner becomes about 2.9R and a 1R loss becomes about 1.1R. The break-even win rate rises only slightly, from 25% to about 27%.
A ₹1,000 stock with a ₹2 stop. Intraday costs of 0.06% are ₹0.60 per share, or 0.3R. A 3R winner becomes 2.7R and a loss becomes 1.3R. The break-even win rate rises from 25% to about 33%, almost exactly the 34% the slope filter achieved in our test.
Two practical rules follow. First, prefer instruments where your cost per round trip is under a tenth of your typical stop. Second, if the trigger candle is so small that costs would be more than a fifth of the stop, skip the trade, however clean it looks. Fewer trades with room to pay their costs beat many trades that cannot.
Frequently Asked Questions
Should I enter on the EMA 7 / EMA 17 crossover itself?
No — the crossover lags. This setup uses the crossover to establish direction, then waits for slope and one of three candle patterns before entering, rather than trading the cross directly.
What counts as a strong enough slope?
An angle on screen changes with chart zoom, so use something objective: EMA 7 rising (or falling) for at least the last three candles, with the gap to EMA 17 widening. If the lines look flat or are tangled together, momentum isn't there yet — wait.
What timeframes does this work on?
It's built for the 5-minute chart for entries with 1-hour confirmation, though the same logic can be adapted to 1-minute scalping or stretched into swing entries on higher timeframes.
Why is the stop-loss so tight?
A tight stop just beyond the trigger candle keeps risk small, so a 1:3 target is often within reach of the next swing. Not every trade will get there; the method relies on winners being about three times the size of losers, not on a high win rate.
Does the EMA 7/17 slope filter improve results?
Yes, in our test. On real NIFTY 50 and NSE stock 5-minute prices from August to November 2026, adding the slope rule cut trades by 60% and raised the average result from +0.15R to +0.20R per trade before costs.
Which trigger candle works best for the EMA 7/17 strategy?
In our test, strong trend candles did best (+0.22R per trade before costs, 35% reaching 3R), followed by engulfing candles. Pin bars were the weakest trigger, winning only 29% of the time.
Related Scalping Strategies